Evaluation of the reproducibility of Parallel Artificial Membrane Permeation Assays (PAMPA)
Daniel Schmidt, John Lynch, PhD
Abstract
The reproducibility and precision of an automation compatible, high throughput method for predicting passive, intestinal absorption was assessed. The Parallel Artificial Membrane Permeation Assay (PAMPA) has been previously reported1, 2, and is based on the use of a 96-well membrane filter based plate. The permeability of six drugs (propranolol, methotrexate, warfarin, carbamazepine, furosemide, and testosterone) was measured on different days using three different lots of plates. In addition, several protocol variations (volume of lipid solution, time between lipid application and drug addition, etc.) were tested to simulate the analytical variability that might be encountered from lab to lab and from operator to operator. The results presented in this Application Note demonstrate that under typical conditions, the PAMPA assay is robust and generates reproducible data. Small protocol variations can have an effect on the apparent permeability rates of some drugs, but in general, the rank order by log Pe (log of the effective permeability) of the compounds is unaffected. As would be expected, variation in the lipid content can significantly alter log Pe results for some compounds. This observation supports the use of the PAMPA method to measure permeability through lipid formulations that simulate different membrane types (e.g., blood–brain barrier, mitochondrial membrane, etc.).
Introduction
PAMPA is a non-cell based assay designed to predict passive, trans- cellular permeability of drugs in early drug discovery. The assay is carried out in a 96-well, MultiScreen-IP PAMPA filter plate (cat. MAIPNTR10 or MAIPN4510). The ability of compounds to diffuse from a donor compartment, through a PVDF membrane filter pretreated with a lipid-containing organic solvent, into an acceptor compartment is evaluated.
After the artificial membrane has been applied to the PVDF membrane filter in the filter plate (known as the Donor plate), the 96-well Donor plate is immediately filled with buffer solutions containing the compounds to be tested. The Donor plate is then placed upon a 96-well Acceptor plate filled with sufficient buffer to ensure liquid contact between the buffer in the acceptor plate and the PVDF membrane filter. The Acceptor plate should be made of PTFE (recommended; Millipore cat. MSSACCEPT0R) or an equivalent, low-binding plastic MATRNPS50. (N.B. The Acceptor plate is not supplied with filter plate). The Donor and Acceptor plates are incubated together for 2–16 hours after which the Donor plate is removed from the Acceptor plate (Figure 1). The 96 wells in the Acceptor plate can be directly analyzed by LC/MS or transferred to a UV compatible 96-well plate and analyzed immediately in a UV/Vis spectrophotometer. The PAMPA method can also be used to determine the effect of pH on compound permeability by adjusting the Ph of the solutions used in the analysis. These plates are particularly recommended for use in pre-ADME or Discovery programs requiring compound rank ordering or profiling.

Figure 1.Individual Donor/Acceptor Well Assembly Before and After Incubation
General Protocol
Considerations
In addition to the MultiScreen-IP PAMPA (Donor) filter plate and an Acceptor plate (MSSACCEPT0R or equivalent MATRNPS50), a UV/Vis spectrophotometer capable of analyzing 96-well plates and UV compatible, 96-well sample plates are also required to run the assay. Sonication of the lipid/organic solvent solution is recommended to ensure complete dissolution of the lipid prior to membrane application.
Experimental Materials
Methotrexate (cat. A-7019), propranolol (cat. P-0884), warfarin (cat. A-2250), carbamazepine (cat.C-8981), furosemide (cat. F-4381), testosterone (cat. T-1500), phenazopyridine (cat. P-8420), L-∂-phosphatidylcholine "lecithin" (cat. P-3556) n-dodecane (cat. D-4259), dimethyl sulfoxide (cat. D-8779) and phosphate buffered saline (PBS) (cat. P-3813) were purchased from Sigma Chemical Co. (St. Louis, MO). MultiScreen-IP PAMPA assay plates (cat. MAIPNTR10 or MAIPN4550 with underdrain removed) and PTFE Acceptor plates (cat. MSSACCEPT0R or MATRNPS50) are available from Millipore Corporation (Billerica, MA). A SPECTRAmax® Plus microtiter plate reader, SoftMax® Pro and a UV compatible quartz plate (part no. R8024) were purchased from Molecular Devices (Sunnyvale, CA). A sonicator/cell disruptor was purchased from Branson Ultrasonics (Mumbai, India). Polypropylene reagent reservoirs (cat.175-RBAS-000) were purchased from ELKay Laboratory Consumables (Shrewsbury, MA). A Finnpipette® electronic pipettor (cat. 21377232) was purchased from ThermoLabsystems (Helsinki, Finland). A BioHit™ 8 channel electronic pipettor and polypropylene tips (cat. W67-710-800 and W16-160045) were purchased from Vangard International (Neptune, NJ).
Methods
The following protocol was used to determine log Pe for methotrexate, propranolol, warfarin, carbamazepine,furosemide and testosterone.
- Prepare a 1% solution (w/v) of lecithin in dodecane (~500 µL/ plate) and sonicate the mixture to ensure complete dissolution.
- Carefully pipette 5 µL of the lecithin/dodecane mixture into each Donor plate well, avoiding pipette tip contact with the membrane. Note: use polypropylene reservoir.
- Immediately after the application of the artificial membrane, add 150 µL of drug-containing donor solutions (drugs dissolved in 5% DMSO, PBS) to each well of the Donor plate (in the experiments described in this Application Note, the testosterone donor concentration was 100 µM. All other drugs were added at a concentration of 500 µM).
- Add 300 µL of buffer (5% DMSO in PBS, pH 7.4) to each well of the PTFE Acceptor plate (MSSACCEPT0R or MATRNPS50).
- Place the drug-filled Donor plate into the Acceptor plate, making sure the underside of the membrane is in contact with the buffer.
- Replace plate lid and incubate at room temperature for 16 hours. Note: place the assembled plate into a sealed container with wet paper towels to avoid evaporation.
- After incubation, measure UV/Vis absorption from 250 to 500 nm for 100 µL/well of the donor solution and 250 µL/well of the acceptor solution.
- Make up drug solutions at the theoretical equilibrium concentration (i.e., the resulting concentration if the donor and acceptor solutions were simply combined) and measure UV/Vis absorption from 250 to 500 nm for 250 µL/well of each.
Calculate log Pe using the equation below.

Calculate log Pe equation
Drug Standard Curves
Standard curves were prepared to determine limits of quantification (LOQ) for each drug when using UV/Vis spectroscopy as the detection method. The LOQ is defined as the concentration of compound whose absorbance (optical density, OD) is five times greater than the standard deviation of the background (noise) absorbance. Two-fold serial dilutions starting at 100 µM of each drug were made in 5% DMSO/PBS. UV/Vis absorbance for each dilution was measured across 250–500 nm in 10 nm steps using the SPECTRAmax Plus plate reader and quartz sample plate. Peak maximum and area under the curve data were then plotted for each drug (Figures 2–7). Table 1 compares the Limit of Quantification to the typical concentration found in the Acceptor plate. UV/Vis absorbance detection works for all the drugs in the study except for methotrexate, since the LOQ is almost 4 times higher than the typical acceptor concentration.
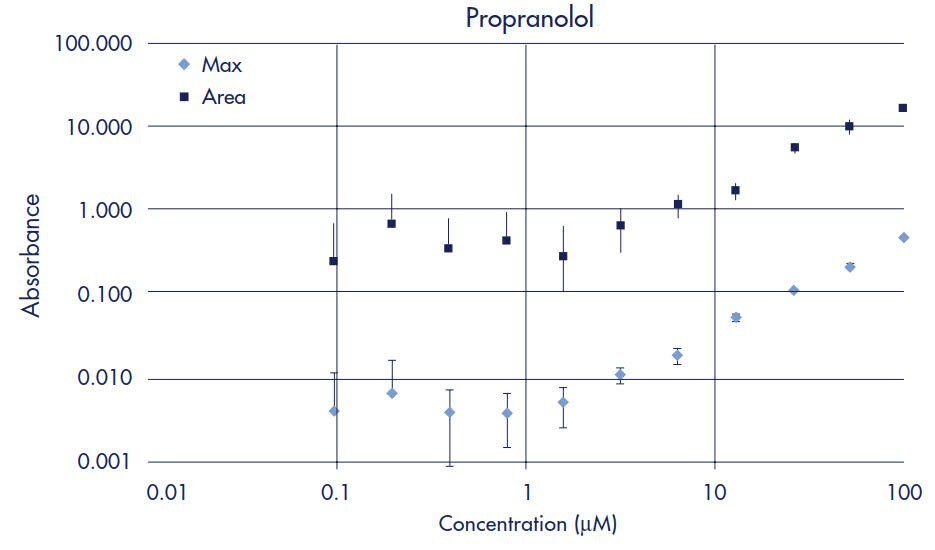
Figure 2.Propranolol Standard Curve
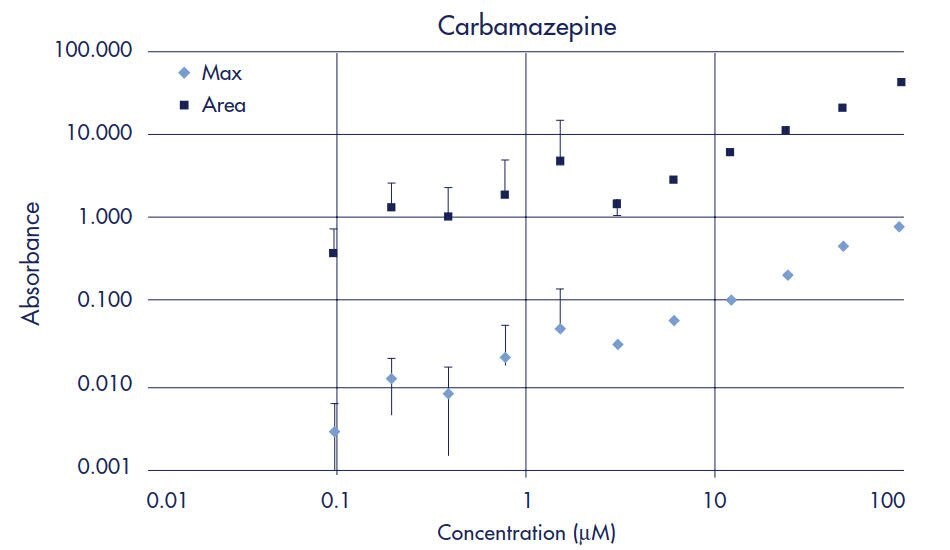
Figure 3.Carbamazepine Standard Curve
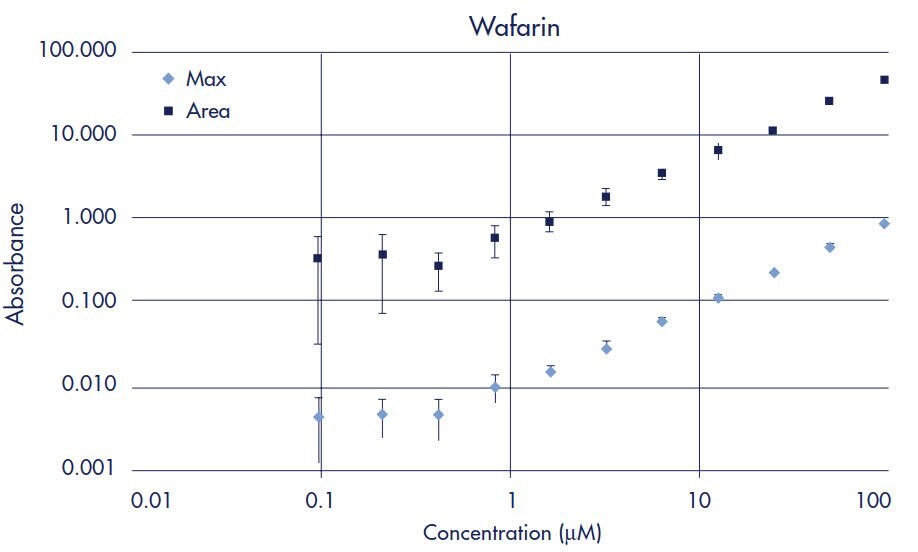
Figure 4.Warfarin Standard Curve
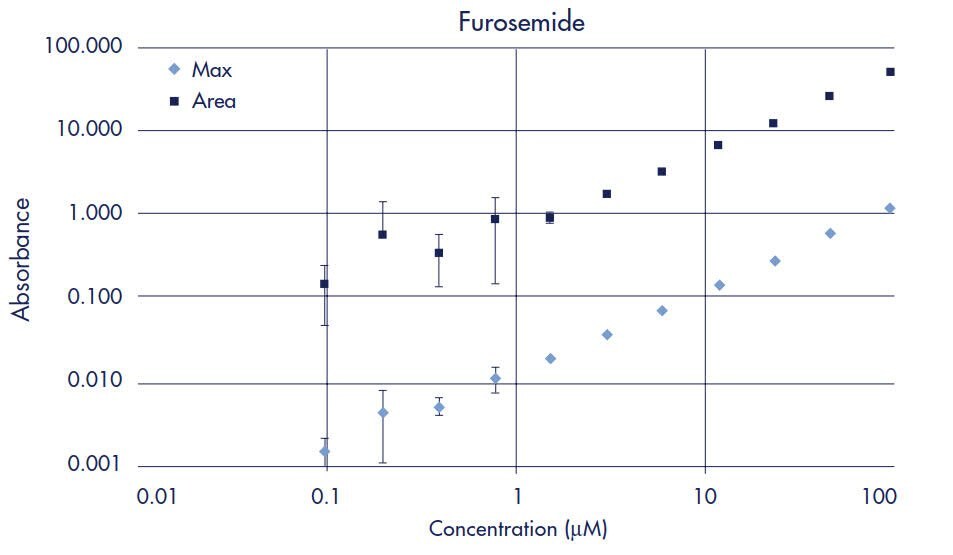
Figure 5.Furosemide Standard Curve
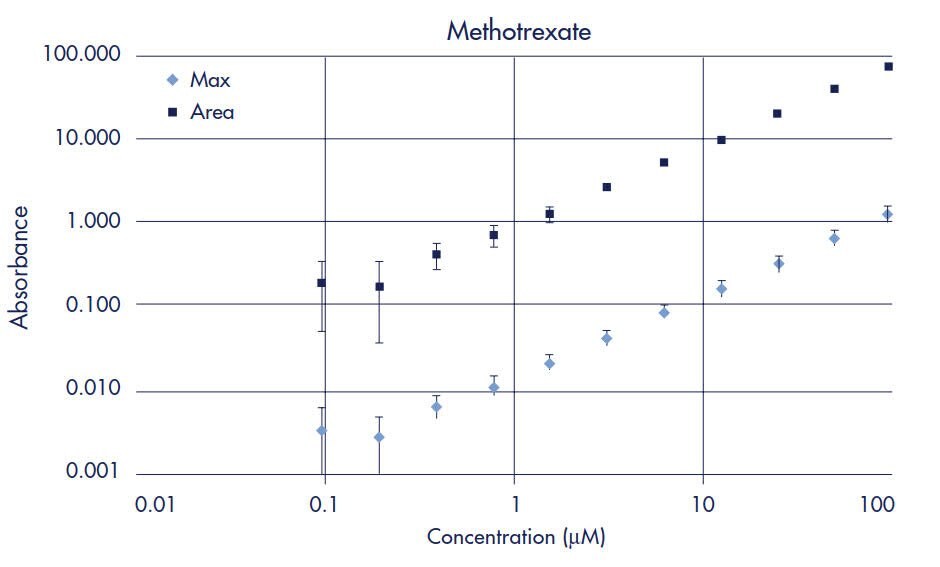
Figure 6.Methotrexate Standard Curve
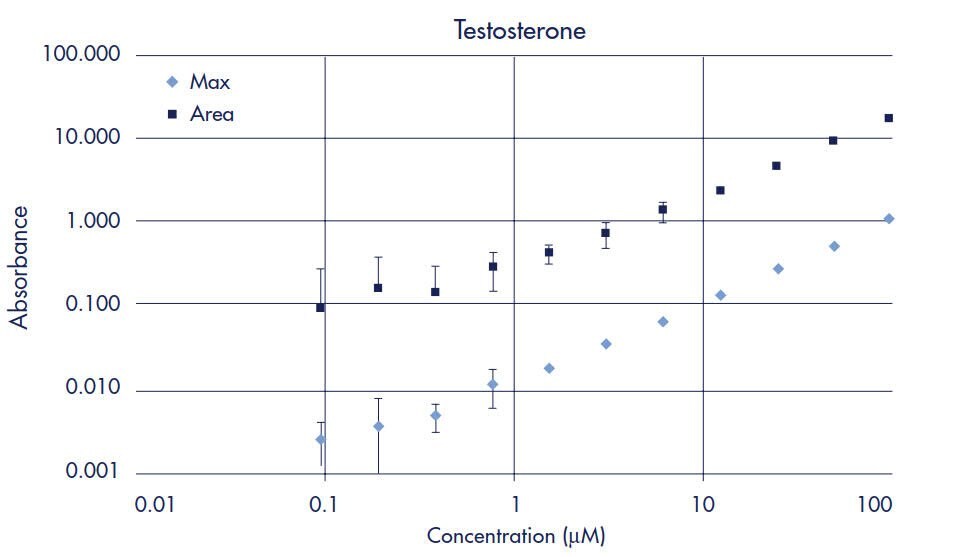
Figure 7.Testosterone Standard Curve
Results
Reproducibility
To assess the analytical variability (precision) within a plate, the permeability of the six drugs listed in Table 2 was measured in a single 96-well plate. Each value in Table 2 is the average log Pe calculated from 16 readings (wells) per drug plus or minus the standard deviation.
The six drugs listed in Table 3 were assayed for permeability using six different plates over two days to measure plate-to-plate reproducibility. Each Log Pe value in the table is the average of 16 wells per drug for each plate plus or minus the standard deviation.
To determine the assay repro- ducibility from day-to-day, the six drugs were assayed for permeability on six different days, in three different plates per day using 16 wells per plate. These results (averages and standard deviations) are presented in Table 4.
Three different lots of membrane were tested to determine (membrane) lot-to-lot reproducibility. All assays were performed using the standard protocol described in the methods section and the results are presented in Table 5. Each value in the table is the average of 96 replicates (16 replicates/plate from 6 plates of each lot).
Effects of Protocol Variability
Summarized in Table 6 and Table 7 are the log Pe results obtained using slightly modified protocols. These experiments were conducted to determine the impact of minor protocol changes (especially lecithin concen- tration and applied volume) on assay results. The last four rows of Table 6 show the impact of a time delay between the addition of the lecithin solution and the addition of the drug solutions. The average and standard deviation for the standard protocol includes data from at least 3 plate lots, 6 different days and 3 plates with 16 wells for each drug per plate (i.e., at least 1728 assays). For each of the protocol changes, 1 plate was evaluated with 16 wells for each drug. Summarized in Table 7 are the results of varying the concentration of lecithin on the permeability of phenazopyridine. Each value in the table is the average of 6 replicates for each filter treatment.
Time Course Studies
Diffusion of the tested compounds from the donor to acceptor compartments was monitored at various times over 48 hours. Drugs were added to successive rows of a Donor plate at a set time (48, 32, 28, 24, 8, 6, 4, 2 hrs) prior to (Donor/Acceptor) plate separation and analysis by UV/Vis. Each row of the plate had 2 replicates for each of the 6 drugs and three plates were assayed resulting in a total of 6 replicates of each drug per time point. The ratio of the OD of the donor replicates to the OD of the initial Donor solution is plotted in Figure 9 for the Donor plates. The ratio of the OD of acceptor replicates to the OD of the Equilibrium solution is plotted in Figure 10 for the Acceptor plates. The log Pe calculated for each time point is listed in Table 8.

Figure 8.Ratio of OD Donor/OD Initial Donor

Figure 9.Ratio of OD Acceptor/OD Equilibrium
Average Log Pe for Different Incubation Times |
|---|
Discussion
The permeability of the 7 drugs was determined using a donor plate concentration of 500 µM. For testosterone and phenazopyridine, the donor plate concentration was reduced to 100 µM after initial testing revealed their marginal solubility at the higher concentration. Overall, there were no significant (<0.2 log units) variations due to well-to-well, plate-to- plate, day-to-day and lot-to-lot changes for the medium and high permeability drugs. Log Pe values obtained for the lower permeability drugs, furosemide and methotrexate, were more variable than those obtained for the other drugs due to analytical imprecision associated with being at or near the LOQ (using the standard, 12 to 16 hour incubation period).
In addition to testing assay repro- ducibility, several small protocol changes were tested to determine the effect that typical protocol variability might have on the calculated log Pe. Tables of the tested protocol changes can be found in the results section (Tables 6 and 7). By and large, the impact of any of these protocol modifications is quite small and does not result in any change in the rank ordering of compound permeability within the test panel of six drugs. The composition of the lipid artificial membrane for the experiments described was 1% L-a-phosphatidylcholine (lecithin) in dodecane. The lecithin concentration was chosen from the lower end of the range of described literature values primarily for the sake of simplicity. A lipid artificial membrane of 1% lecithin in dodecane is likely not appropriate for accurate permeability ranking of all drug classes. For a particular target barrier, it is critical to choose the appropriate lipid mixture and lipid concentration to ensure accurate permeability ranking and correlation with human absorption data. Screening a large, diverse panel of commercially available compounds provides valuable information to aid in the selection of the appropriate lipid membrane constituents. For example, changes in the applied amount of lecithin solution or the concentration of the lecithin resulted in little or no change in the observed permeability rates of the test panel of six drugs (Table 6). However, when phenazopyridine was tested under some of the same conditions, there were significant changes in its observed permeability rates (Table 7). A 48-hour time course experiment was performed to monitor the concen- tration changes of the donor and acceptor compartments for all six drugs. Graphs of the OD readings for each drug can be seen in the results section (See Figures 3 & 4). This type of experiment is useful for determining the appropriate length of transport time to achieve reproducible results. The calculated log Pe for high and medium permeable drugs varied ≤ 0.4 log between time points, whereas significant change was observed over time with low permeability compounds.
The fact that the log Pe calculated for each point does not change significantly for high and medium permeable drugs over 4–48 hours is an indication of the robustness of the equation. As with any assay, there is an initial learning curve and periods of trial and error before reproducible results are obtained. Experience and familiarity with an assay helps in spotting potential problems and making adjustments accordingly. Some potential pitfalls are not obvious, such as a drug’s ability to be assayed by UV/Vis spectroscopy. Many drugs are not good UV/Vis chromophores so the proper analytical techniques must be chosen accordingly. Refer to Table 1 for limits of detection determined from the standard curves of the six drugs assayed. Carba- mazepine, for example, exhibits a comparatively high limit of detection by UV/Vis; however, due to its relatively high permeability, sufficient quantities are present in the acceptor compartment to permit the use of this detection method. Methotrexate, on the other hand, is a good UV/Vis chromophore and exhibits a much lower limit of detection. Due to its slow permeability rate, however, very little compound is present in the acceptor volume to be measured. Consequently, greater variability in the calculated log Pe of methotrexate is observed. A more sensitive detection method should be used for methotrexate (i.e., LC/MS). Another significant source of method error may be related to compound solubility. Initial attempts to measure testosterone permeability were conducted using a donor solution concentration of 500 µM— a concentration at which testosterone is only marginally soluble. This resulted in the drug partitioning onto the plate and membrane surfaces—thereby rendering accurate log Pe calculations impossible.
Conclusions
The PAMPA assay is a robust and reproducible assay for determining passive, transcellular compound permeability. PAMPA is automation compatible, relatively fast (4–16 hours), inexpensive and straightforward. The majority of drugs (>80%) enter the blood stream by passive diffusion through the intestinal epithelium. Consequently, permeability assays, such as PAMPA, that measure passive transport through lipophilic barriers correlate with human drug absorption values from published methods. The PAMPA assay provides the benefits of a biologically relevant membrane and the ability to tailor the membrane to a specific target such as the blood– brain barrier. Optimization of the incubation time, lipid mixture and lipid concentration will also enhance the assay’s ability to mimic the target barrier.
References
To continue reading please sign in or create an account.
Don't Have An Account?