Dynamic Live Cell Imaging of Caspase Mediated Apoptosis and Cellular Hypoxia in Lymphocytes and Cancer Cells Using the CellASIC® ONIX2 Microfluidic Platform
Cindy Chen, PhD., Jun Park, Ph.D., Nick Asbrock
Live cell imaging is an ideal method for measuring the hallmarks of cancer, such as apoptosis and hypoxia. Cancer cells are known for their ability to escape apoptosis, the mechanism by which a cell activates its own death in response to external stimuli. Hypoxia, an environment characterized by low oxygen, is another common characteristic of solid tumors. Hypoxic cancer cells are typically more resistant to apoptosis and chemotherapy, enabling metastasis and aggressive malignant phenotypes. A hypoxic microenvironment devoid of nutrients prevents the cell from undergoing energy dependent apoptosis and cells become necrotic. Hypoxia inducible factor 1 (HIF-1), can initiate apoptosis by inducing high concentrations of proapoptotic proteins, such as BNIP3, and can cause stabilization of p53. Caspases are a family of protease enzymes that play an essential role in programmed cell death and inflammation. Severe hypoxia can induce caspase-9 and caspase-3 activation which leads to apoptosis.
Traditional assays to measure apoptosis (Annexin-V, Caspase and TUNEL assays) and hypoxia (HIF1α expression and Hypoxyprobe/EF5) are end-point assays that require cell fixation or lysis and do not capture real-time responses. Capturing live cell apoptotic and hypoxic events permits single cell analysis and real-time single cell tracking under physiological conditions, which produces more relevant data. Here we utilize BioTracker live cell dyes for caspase-3 and hypoxia to measure apoptosis and hypoxia in living cells on the CellASIC® ONIX2 Microfluidic System.
Figure 1. Mechanism of BioTracker live cell fluorescent apoptosis and hypoxia dyes.The BioTracker NucView® 488 green caspase-3 dye consists of a fluorogenic DNA dye coupled to the caspase-3/7 DEVD recognition sequence. The dye, which is initially non-fluorescent, penetrates the plasma membrane and enters the cytoplasm. In apoptotic cells, caspase-3/7 cleaves the substrate, releasing the high-affinity DNA dye, which migrates to the cell nucleus and stains DNA with bright green fluorescence. Reductive cleavage of the azo base in the BioTracker 520 green hypoxia dye occurs under hypoxic conditions generating 2Me RG which emits bright green fluorescence. Lower oxygen levels (more severe hypoxic conditions) lead to greater fluorescence intensities.
Methods and Results
Live Cell Imaging Videos
Apoptosis
Hypoxia
Live Cell Apoptosis Imaging Experiments
Jurkat cells (88042803) were first loaded onto the CellASIC ONIX M04T Pad Trap Plate (M04T-01-5PK) and were then incubated with BioTracker NucView® 488 Green Caspase-3 Dye (SCT101) for 30 minutes in complete RPMI-1640 media (SLM-240-B), followed by treatment of 2.5 µg/mL CD-95 antibody (05-201) (experiment group) or no treatment (control) for 12 hours. Time-lapse imaging was taken on cells at a 30-minute interval under 400x magnification using a FITC filter.

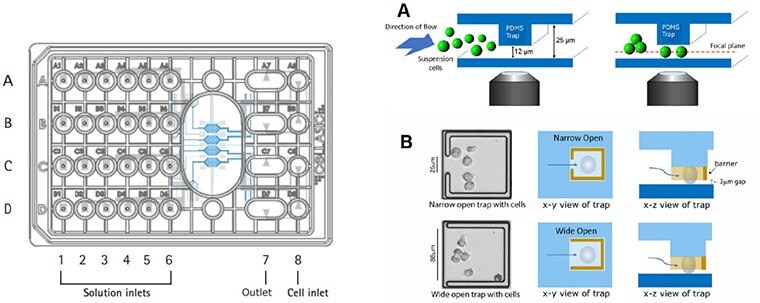
Figure 2. cellasic® onix m04t pad trap plate design.The Trap plates utilize a 4-chamber cell culture plate designed to maintain cells within a single focal plane during live cell imaging experiments. This plate enables real-time imaging of 12 µm-sized suspension cells at single cell resolution with precise environmental control.

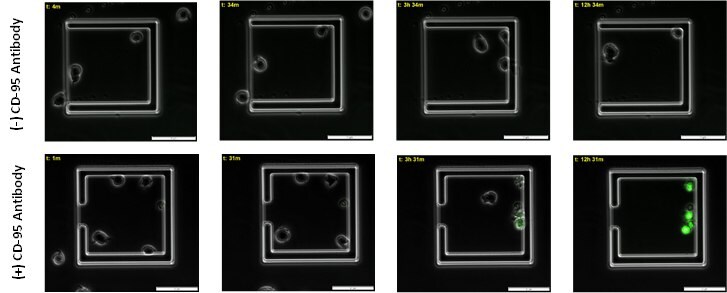
Figure 3. Time course of caspase mediated apoptosis in live immune cells.Apoptotic jurkat cells begin to emit caspase mediated green fluorescence around 3 hour post CD-95 antibody incubation in live cells. 12 hours post incubation with CD-95 antibody 100% of cells emit green fluorencence and are apoptotic.
Jurkat cells (88042803) were first loaded onto the CellASIC ONIX M04T Pad Trap Plate (M04T-01-5PK) and were then incubated with BioTracker NucView® 488 Green Caspase-3 Dye (SCT101) and Annexin V Texas Red (Red) for the first 2 hours in complete RPMI-1640 media (SLM-240-B), followed by treatment of 2.5 µg/mL CD-95 antibody (05-201) (experiment group) or no treatment (control) for 8 hours. Time-lapse imaging was taken on cells at a 10-minute interval under 400x magnification using a FITC and Texas-Red filter.

Figure 4. Time course of multiple apoptotic events in live immune cells.Apoptotic jurkat cells begin to emit caspase mediated green fluorescence around 3 hours post CD-95 antibody incubation followed by Annexin V mediated red fluorescence at 8 hours. Double labelled cells are appear yellow.
Live Cell Hypoxia Imaging Experiments
A431 epidermal carcinoma cells (85090402) were incubated 16 hours overnight with or without 3μM BioTracker 520 Green Hypoxia Dye (SCT033) in complete DMEM (SLM-241-B) by gravity perfusion at 37 °C under normoxic condition (20% O2) ) using the CellASIC® ONIX2 System (M04S-03-5PK). After overnight culturing, cells were perfused with complete media without dye at 1psi under hypoxic condition (0% O2) for 16 hours at 37 °C. Images were taken from cells treated with and without dye after 16 hours culturing under hypoxic conditions (0% O2) under the identical image settings using FITC channel. For time course experiment, fluorescent images were captured every 3 hours over a 16-hour time.

Figure 5. CellASIC® ONIX switching plate for mammalian cells design.The M04 switching plates enable continuous perfusion culture for live cell analysis. Laminar flow provides rapid & uniform solution exchange for maximum cell health. The glass cover slide bottom surface ensures the highest resolution optical viewing.

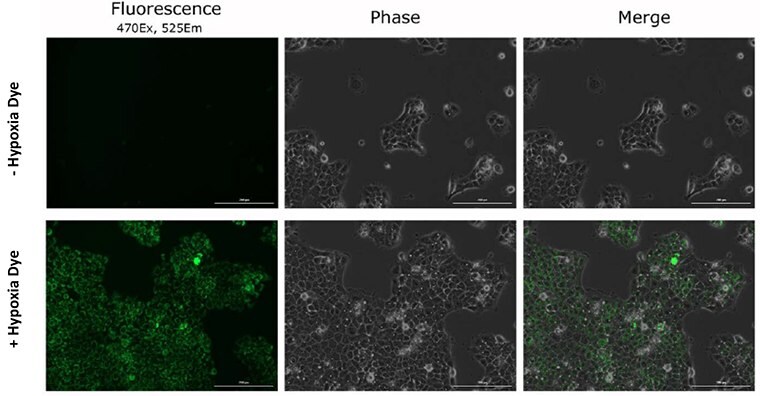
Figure 6. Dye specificity of hypoxia in live cancer cells.After 16-hours of hypoxia exposure the BioTracker 520 Green Hypoxia Dye increases in fluorescence intensity identifying hypoxic cells.

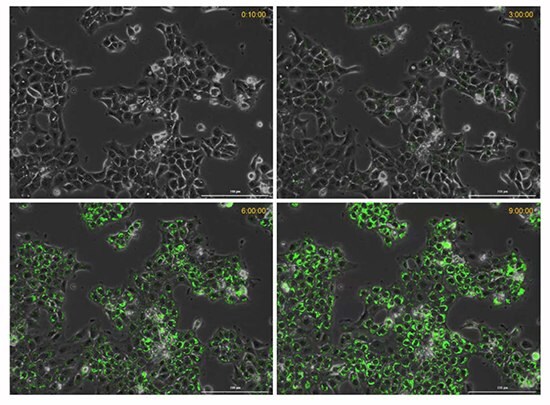
Figure 7. Time course of hypoxia in live cancer cells.The BioTracker 520 Green Hypoxia Dye increases in fluorescence intensity with decreasing oxygen levels (increased hypoxic conditions) over a 9-hour time period.
Conclusion
Programmed cell death/apoptosis and hypoxia play a crucial role during the development and homeostasis of many biological systems. While much of the studies have relied on biochemical or molecular approaches to investigate, live cell imaging of apoptotic and hypoxic processes in suspension cells presents unique challenges due to their nonadherent nature. Here we present dynamic live cell imaging of CD95 (Fas,Apo1) mediated apoptotic process of Jurkat Tcells and hypoxic A431 cancer cells at single cell level using the CellASIC ONIX microfluidic system. Using a caspase-3 specific DNA binding probe (SCT101) and a cellualr reductase mediatiated hypoxia dye (SCT033), we visualize the onset of apoptotic nuclear morphology and phosphatidylserine(PS) translocation and hypoxia, respectively, in a multiplexed fashion. We successfully monitor temporal population dynamics of CD95 induced Tcell apoptosis and hypoxia at single cell level with clear delineation of kinetics between these two apoptotic events,as well as the heterogeneity of responses to CD95. By enabling single cell monitoring of cellular responses to vary ingreagents via on demand perturbation, the technology can provide deeper insights into the mechanism of apoptosis and hypoxia, and is also amendable to wide ranging live cell image based study of cell biology in general.
To continue reading please sign in or create an account.
Don't Have An Account?