Chiral and Achiral LC-MS Analysis of Warfarin™ in Plasma Samples
Tracy, L, Ascah, R, Craig, Aurand
Reporter US Volume 31.2
Clinical laboratories are beginning to reap the benefits of LC-MS in terms of its sensitivity, specificity, throughput, and potential to reduce cost per sample. The purpose of this study was to demonstrate the LC-MS analysis of Warfarin in plasma samples utilizing chiral and achiral (reversed-phase) chromatography and effective sample prep to remove endogenous phospholipids
Clinical Interest in Warfarin
Warfarin, sold under brand names Coumadin®, Jantoven® and others, is still the most widely prescribed oral anticoagulant for treatment and prevention of thrombosis and thromboembolism despite the introduction of newer drugs1. The pharmacological effect of Warfarin is derived from its ability to inhibit the enzyme vitamin K epoxide reductase, thereby reducing circulating levels of vitamin K which is required in the clotting process2.
An estimated two million new Warfarin prescriptions are issued each year in the U.S.2 In spite of its popularity, there are some downsides to Warfarin, including a relatively narrow therapeutic index, interactions with other clinically important drugs, side effects, genetic variation in Warfarin metabolism, frequent migration of blood levels outside the therapeutic range, bleeding events, and variability in time to reach therapeutic levels3. These, and the fact that Warfarin is the second leading cause of drug-related emergency room visits, make it a commonly analyzed compound in the clinical lab4.
Warfarin is a chiral compound comprising an equal mixture of (R) and (S) enantiomers (Figure 1). (S)-Warfarin is considerably more potent and pharmacologically active than (R)-Warfarin. The two enantiomers are metabolized by different pathways involving several cytochrome P450 (CYP) enzymes. Active biochemical research is aimed at predicting Warfarin metabolism based on the patient’s CYP (especially CYP2C9) genotype3.
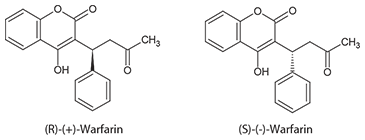
Figure 1. Structure of Warfarin Enantiomers
Improved LC-MS Analysis of Warfarin and Warfarin Enantiomers
Monitoring of total Warfarin in the blood helps ensure positive patient outcomes after heart attacks, surgery and other medical procedures or conditions where blood clotting must be controlled. Measuring post-dose levels of Warfarin enantiomers in the blood is of clinical research interest because it gives an indication of the patient’s Warfarin metabolic profile, which may help physicians make more informed decisions about therapeutic regimens for patients undergoing long-term Warfarin therapy.
The clinical implications and importance of therapeutic drug monitoring of Warfarin necessitate reliable and sensitive analytical methods, like UHPLC-MSn, to detect and quantify Warfarin and its enantiomers in serum. In this study, we report on the use of specific analytical consumables – sample prep devices, HPLC, UHPLC columns and solvents, and certified reference materials – that have been designed to maximize sensitivity, throughput and reliability of bioanalytical and clinical analyses.
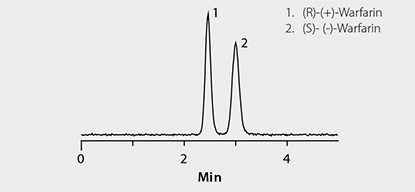
Figure 2. Rapid HPLC Separation of Warfarin Enantiomers on Astec CHIROBIOTIC V
Conditions
LC-MS system: Agilent® 1290, 6210 TOF; column: Astec CHIROBIOTIC V, 10 cm x 4.6 mm I.D., 5 µm (Product No. 11022AST); mobile phase: (A) 0.1% formic acid (pH unadjusted); (B) acetonitrile, 75:25 (A:B); flow rate: 1 mL/min; column temp.: 35 °C; detection: ESI+, 100-1000 m/z; sample: Warfarin standard, 300 ng/mL in 75:25 (1% formic acid acetonitrile:water); injection: 2 µL
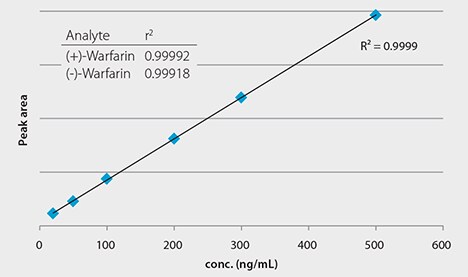
Figure 3. Calibration Curve Obtained for Warfarin Enantiomers
Conditions
same as Figure 2
Experimental
Standard Solutions
Standard solutions were prepared from a stock standard in (3:1) 1% formic acid acetonitrile:water at a level of 20, 50, 100, 200, 300, and 500 ng/mL. The use of Cerilliant® Certified Reference Material grade Warfarin ensured reliable quantitation.
Preparation and Extraction of Plasma Samples
Rat plasma stabilized with K2EDTA was acquired from Lampire Biological Laboratories (Pipersville, PA). Plasma was spiked directly from stock standard to a level of 400 ng/mL.
HybridSPE®-Phospholipid 96-well method: Apply 100 µL of spiked plasma to the well, followed by 300 µL of 1% formic acid in acetonitrile. Agitate via vortex for four minutes, place on vacuum manifold and apply 10" Hg vacuum for four minutes. Collect filtrate and analyze directly.
Standard protein precipitation method: Apply 100 µL of plasma to centrifuge vial, followed by 300 µL of 1% formic acid in acetonitrile. Agitate via vortex for four minutes, place vial in centrifuge and spin at 15,000 rpm for two minutes. Collect supernatant and analyze directly. Analyte concentration of final sample work up in both techniques was equivalent to 100 ng/mL.
Phospholipid Monitoring
Processed spiked plasma samples were analyzed for target drug and metabolites along with associated matrix interference. Phospholipids were monitored over a range of both lyso and glycero phospholipids (lysophosphatidylcholines at 496.3 and 524.3 m/z; glycerophosphocholines at 758.5, 786.5, 806.5 and 810.5 m/z).
Chromatography
Reversed-phase (achiral) separation of Warfarin was carried out on an Ascentis® Express Fused-Core® C18 column. The benefit of this column for UHPLC/LC-MS users in clinical, bioanalytical, or forensic laboratories is high speed for high sample throughput, high efficiency for high s/n ratio, and ruggedness to stand up to biological samples without fouling or overpressuring. The UHPLC-like benefits of speed and sensitivity of the Ascentis Express columns is attainable on any HPLC system.
The chiral separation of Warfarin enantiomers was achieved on an Astec® CHIROBIOTIC® V chiral stationary phase (CSP). Four features of the macrocyclic glycopeptide chiral selectors behind the CHIROBIOTIC phases, in this case vancomycin, make them ideal for LC-MS operation in a clinical or bioanalytical laboratory setting. First, they operate in aqueous and polar organic mobile phases that are amenable to polar drugs and metabolites. Second, they possess ionic interactions and provide chiral selectivity under mobile phase conditions that promote analyte ionization. In fact, Astec CHIROBIOTIC columns are distinct from other CSPs in their suitability for ESI-MS detection. Third, they are covalently bonded to the silica surface for durability and long column lifetime. Fourth, chiral separations on Astec CHIROBIOTIC columns are typically very fast, promoting laboratory throughput.
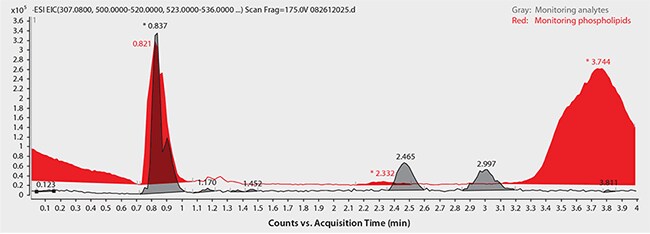
Figure 4. Analysis of Warfarin Enantiomers in Plasma Following Sample Prep Using Protein Precipitation
Conditions
same as Figure 2 except, sample/matrix: rat plasma, unfiltered K2-EDTA, spiked with Warfarin at 100 ng/mL (3:1, plasma:1% formic acid in acetonitrile)
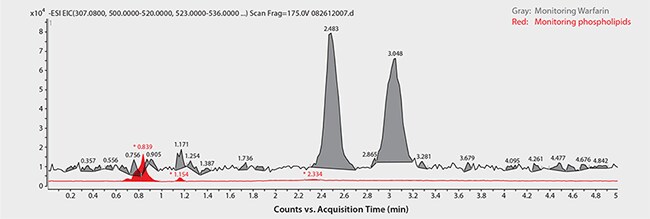
Figure 5. Analysis of Warfarin Enantiomers in Plasma following Sample Prep using HybridSPE-Phospholipid
Conditions
same as Figure 2 except: SPE device: HybridSPE-Phospholipid, 96-well plate (Product No. 575656- U); sample/matrix: rat plasma, unfiltered K2-EDTA, spiked with Warfarin at 100 ng/mL (3:1, plasma:1% formic acid in acetonitrile); sample addition: to each well add 100 µL plasma, followed by a 300 µL of 1% formic acid in acetonitrile, agitate on orbital shaker for four minutes; elution: attach collection plate and apply vacuum at 10" Hg for four minutes; injection: 2 µL
Results
Chiral LC-MS analysis of the Warfarin reference solution appears in Figure 2. The calibration curve in Figure 3 showed excellent linearity of both enantiomers over the monitored range of 20 to 500 ng/mL. Figures 4 and 5 compare protein precipitation and HybridSPE Phospholipid extraction techniques, respectively. Samples processed with the standard protein precipitation method (Figure 4) exhibited decreasing response of both enantiomers. This was due to sample matrix fouling of the mass spec source and not direct overlap of phospholipid interference. No matrix fouling was observed with the HybridSPE-Phospholipid method (Figure 5). This difference is reflected in the recovery data found in Table 1 and Figure 6, both of which show higher and more consistent recovery of both enantiomers when using the HybridSPE-Phospholipid method. (A comprehensive explanation of matrix effects from endogenous phospholipids and the principle behind the unique HybridSPE Phospholipid method appear in reference 5.)
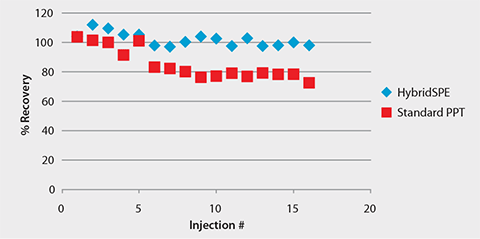
Figure 6. Consistent LC-MS Response of Warfarin Following HybridSPE-Phospholipid Extraction
Regarding the achiral (reversed-phase) HPLC method, Figure 7 shows the chromatograms for monitored ions of Warfarin and total phospholipid content using standard protein precipitation (red trace) or the HybridSPE-Phospholipid sample prep method (blue trace). Notice the direct coelution of Warfarin with a major phospholipid peak along with the intensity difference between target analyte and matrix. This overlap with high abundance of matrix can significantly reduce the response of target analytes. However, by using the HybridSPE-Phospholipid sample prep method, there is no coelution of matrix components within the Warfarin retention window (or anywhere within the run, for that matter).
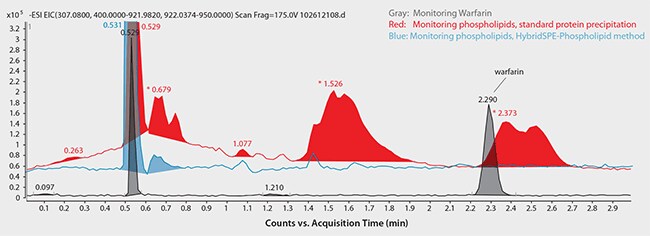
Figure 7. Achiral HPLC Analysis of Warfarin in Plasma following Sample Prep using Protein Precipitation
Conditions
sample/matrix: rat plasma, unfiltered K2-EDTA, spiked with Warfarin at 100 ng/mL (3:1, plasma:1% formic acid in acetonitrile); LC-MS system: Agilent 1290, 6210 TOF; column: Ascentis Express C18, 10 cm x 2.1 mm I.D., 2.7 µm (Product No. 53823-U); mobile phase: (A) 5 mM ammonium formate, pH 4.2 with formic acid; (B) 5 mM ammonium formate in 95:5 acetonitrile:water, 50:50 (A:B); flow rate: 0.3 mL/min; column temp.: 35 °C; detection: ESI+, 100-1000 m/z; sample: Warfarin spiked at 100 ng/mL in 3:1 (plasma:1% formic acid in acetonitrile); injection: 2 µL
Conclusions
LC-MS is an important tool used by clinical, forensic, and bioanalytical researchers to monitor Warfarin and a host of other exogenous and endogenous compounds. It is important that they have analytical tools that will maximize the amount and reliability of information gathered from the patient samples, while also maintaining high laboratory throughput and robust operation of the LC-MS/MS system. Reducing matrix interferences, especially endogenous phospholipids, can greatly improve LC-MS sensitivity, recovery, and reduce instrument downtime. The study presented here demonstrated excellent recovery of racemic Warfarin and the individual enantiomers by using the HybridSPE-Phospholipid technique. Rapid and efficient chiral and achiral separations were obtained using Astec CHIROBIOTIC and Ascentis Express HPLC columns, respectively. As with all LC-MS and UHPLC-MS analyses, the solvent and additive purity does impact the sensitivity and robustness of the method, so it is strongly recommended to use high grade solvents6. Finally, reliable quantitation, so important for obtaining true patient levels, is achieved only by using Certified Reference Materials, like those provided by Cerilliant.
Legal Information
Cerilliant, HybridSPE, Astec, CHIROBIOTIC, and Ascentis are registered trademarks of Sigma-Aldrich Co. LLC
Warfarin is a trademark of Wisconsin Alumni Research Foundation
Coumadin is a registered trademark of Bristol-Myers Squibb Company
Jantoven is a registered trademark of Upsher-Smith Laboratories, Inc.
Agilent is a registered trademark of Agilent Technologies, Inc.
Fused-Core is a registered trademark of Advanced Materials Technology, Inc.
References
続きを確認するには、ログインするか、新規登録が必要です。
アカウントをお持ちではありませんか?