Onyx Quencher™ for Probed-Based qPCR
We offer Onyx Quencher (OQ™), a proprietary quencher for probed-based qPCR. Similar to other dark quenchers, OQ™ emits heat instead of light and therefore offers an improved signal-to-noise ratio compared to traditional fluorescent quenchers, such as TAMRA™. Read our application note to learn how an OQ™ Dual-Labeled Probe was used to develop an assay for the detection of Schistosoma mansoni, the causative agent of Schistosomiasis.
Properties
There are four derivatives of OQ™, which collectively quench a variety of reporter dyes over an excitation maximum range from 515 to 661 nm. Absorption spectra (Figure 1) .

Figure 1.Absorption spectra of OQA, OQB, OQC, and OQD.
Availability
OQ™ is available with Custom Primers, Dual-Labeled Probes, and Molecular Beacons in a variety of scales, quantities, and formats.
Performance
FAM, HEX, JOE, TAMRA, ROX, and Cyanine 5 Dual-Labeled Probes were tested with various derivatives of OQ in the 5’ nuclease assay and were found to perform identically to probes labeled with the same dyes and a comparable dark quencher (CDQ). For these experiments, a synthetic human APOA5 template (112 bases) was used with the following primers and probes:
- Forward primer (5'-AGCAGATAATGGCAAGCA-3')
- Reverse primer (5'-GCTCAAGGCTGTCTTTCA-3')
- Probe (5'-X-ATCTTCTGCTGATGGATCTGCTCC-Y-3') where
- X = FAM, HEX, JOE, TAMRA, ROX, or Cyanine 5
- Y = OQA, OQB, OQC, or OQD and CDQ
All reactions were run with our LuminoCt® qPCR ReadyMix™ with primers and probe at final concentrations of 300 nM each and 200 nM, respectively. The thermal profile was the following:
- Step 1 – 1 x 95°C, 2:00 min
- Step 2 – 40 x 95°C, 10 s
60°C, 40 s - Step 3 – 1 x 40°C, 2:00 min
5’-FAM/3’-OQA
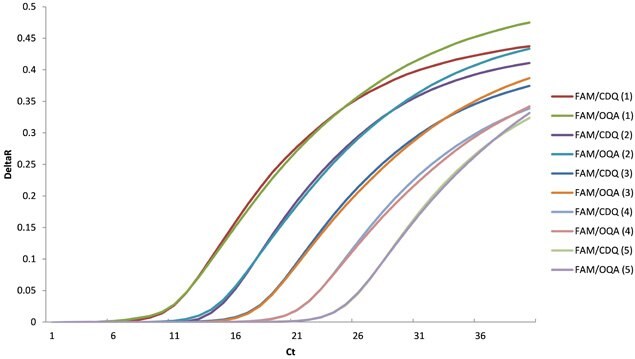
Figure 2.The baseline normalized data for FAM/CDQ and FAM/OQA probes. The sensitivity and end-point fluorescence are identical for each dilution.
5’-HEX/3’-OQA
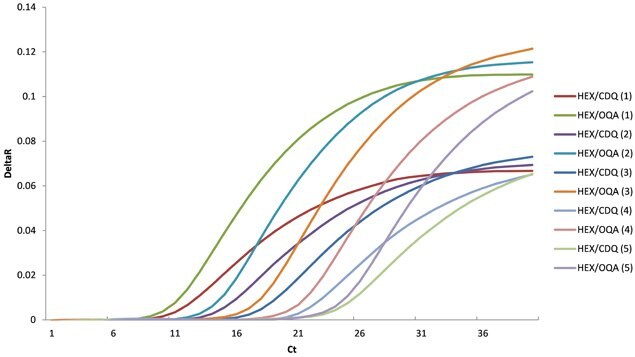
Figure 3.The baseline normalized data for HEX/CDQ and HEX/OQA probes. The sensitivity and end-point fluorescence of OQA are superior to CDQ for each dilution.
5’-JOE/3’-OQA
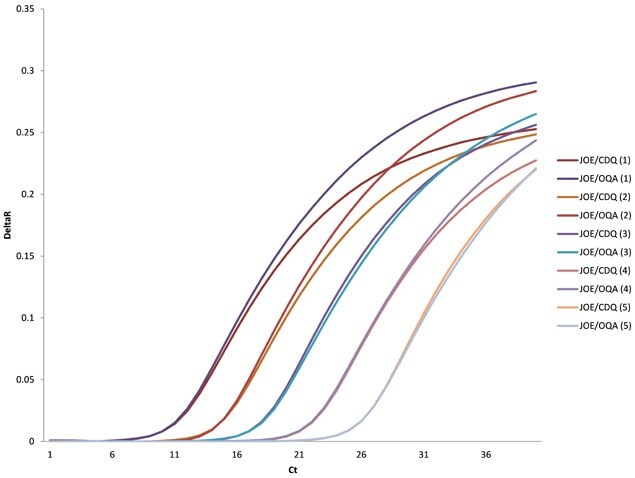
Figure 4.The baseline normalized data for JOE/CDQ and JOE/OQA probes. The sensitivity and end-point fluorescence of OQA are either identical or superior to CDQ for each dilution.
5’-TAMRA/3’-OQB
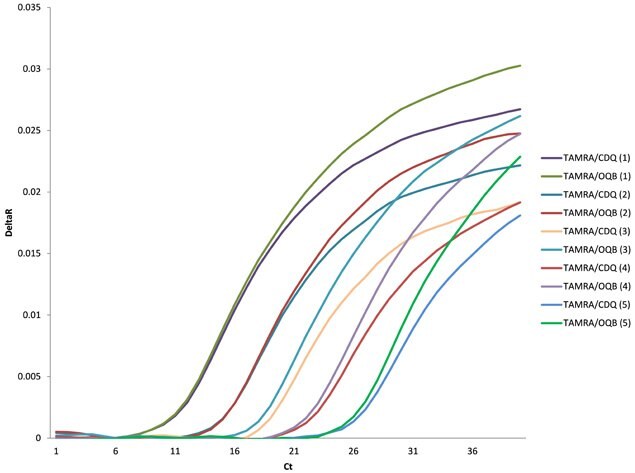
Figure 5.The baseline normalized data for TAMRA/CDQ and TAMRA/OQB probes. The sensitivity and end-point fluorescence of OQB are either identical or superior to CDQ for each dilution.
5’-ROX/3’-OQC
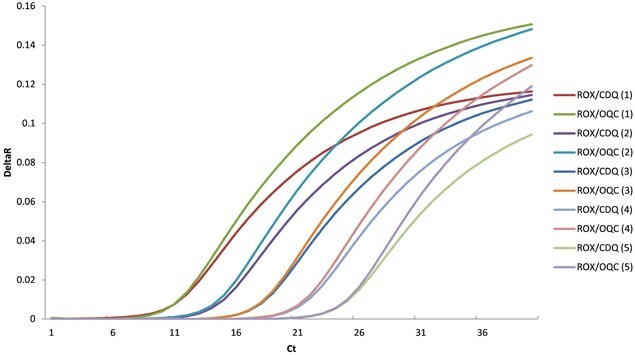
Figure 6.Here is the baseline normalized data for ROX/CDQ and ROX/OQC probes. The sensitivity and end-point fluorescence for OQC are either identical or superior to CDQ for each dilution.
5’-Cyanine 5/3’-OQD
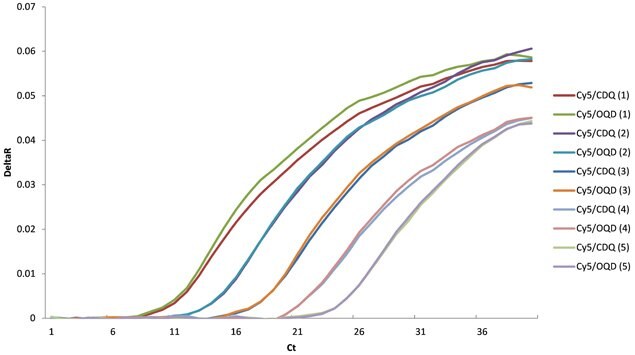
Figure 7.The baseline normalized data for Cyanine 5/CDQ and Cyanine 5/OQD probes. The sensitivity and end-point fluorescence of are identical for each dilution.The baseline normalized data for Cyanine 5/CDQ and Cyanine 5/OQD probes. The sensitivity and end-point fluorescence of are identical for each dilution.
Applications
In addition to qPCR, OQ™ may be used for any other application and is license, royalty, and restriction free, making it an ideal quencher for the development of life science research tools, molecular diagnostics (MDx), and laboratory developed tests (LDTs).
To continue reading please sign in or create an account.
Don't Have An Account?