Mass Spectrometry
What Is Mass Spectrometry and What Is it Used For?
Mass spectrometry (MS) is an analytical tool used to determine the masses of different compounds in a sample. The technique is useful for identifying and quantifying the compounds in a mixture, which can include detecting impurities in a sample or determining the mixture of proteins in a cell sample. It works by measuring the m/z (mass-to-charge) ratio of ions.
How Does Mass Spectrometry Work?
There are many variations on the mass spectrometry theme, but the fundamentals are the same and are approximately three (it can depend on how you prefer to “group” your steps) and they are:
- Ionization (ion source)
- Ion Separation/Isolation (mass analyzer)
- Detection (ion detector)
Note: The entire process should take place in a vacuum.
1. Ionization: The sample is vaporized and ionized. (Note: If the sample cannot be vaporized without decomposing, it cannot be analyzed by mass spec.) Early spectrometry of organic compounds relied on an electron beam, which would have broken proteins. Electrospray ionization (ESI) and matrix-assisted laser desorption ionization (MALDI) can ionize biomolecules without destroying them. Each ionization technique (ESI or MALDI) has its pros and cons.
The ions of the analyte are referred to as “molecular ions” (unless they fragment). Mass spectrometry only measures the mass of charged particles (i.e., ions). Neutral compounds are effectively invisible, but cations (positively charged) and anions (negatively charged) are “seen” (although some types of mass spectrometry involve weeding out anions). Depending on the type of mass spectrometry, ions will have different amounts of charge. For example, MALDI results in single charges, but ESI of large molecules will have greater charges.
2. Ion Separation/Isolation: It is during this stage that the ions are separated by their m/z values using electric and/or magnetic fields. Different types of mass analyzers can be used, but the gist is the same: the interaction between differently charged and sized molecules and the field(s) causes the ions to separate based on the m/z. For electric field separation, what is important is the time of flight (TOF). The size and charge of the ion will determine how quickly the ion reaches the detector. (For example, in an electric field, a more highly charged, small ion will move more quickly than a lower charged larger ion (Figure 1). For magnetic field separation, the different ions will arc differently onto the detector and land in different spots depending, again, on size and charge. In other words, for electric fields, it’s when the ion is detected that matters, but for magnetic fields, what matter is where the ion is detected.
3. Detection: The ions separated by the mass analyzer hit the ion detector, which records on a computer how many ions hit for each specific m/z ratio. Generally, the output is a vertical bar graph whose x-axis represents increasing m/z and whose y-axis represents relative abundance.

Figure 1.Schematic for MALDI-TOF MS (matrix-assisted laser desorption/ionization-time of flight mass spectrometry

Figure 2.A schematic for ESI-MS (electrospray ionization mass spectrometry)
How to Read a Mass Spectrometry Spectrum
The y-axis of the graph represents relative intensity or abundance. The base peak is the peak/bar with the greatest relative abundance. The base peak may or may not be the molecular ion. (Today’s mass spectrometers can easily resolve ions differing by one amu, such as those using a deuterium atom instead of a hydrogen atom.) Each peak on the graph will correspond to a different m/z and intensity. When ions have a single charge, the m/z value will be equivalent to the molecular mass. Typically, the peak with the highest m/z corresponds to the molecular ion, which gives you the relative molecular mass of the compound. (You may have fragments, but you don’t normally get larger compounds.) The spectrum pattern — fragments and molecular ion — taken altogether can identify what the sample is. A database of mass spectrum graphs is helpful for comparing spectra and identifying the sample. NIST has one such database.

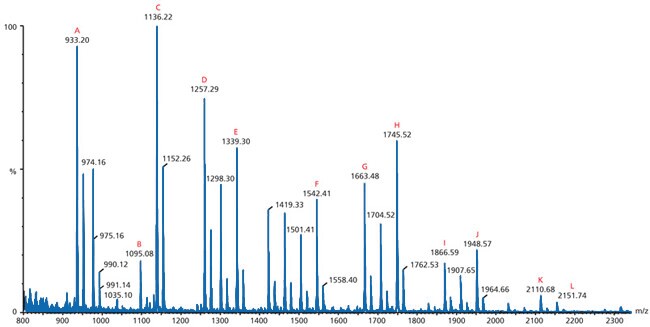
Figure 3.Matrix-assisted Laser Desorption/Ionization
This particular spectrum is an example of matrix-assisted laser desorption/ionization (MALDI) mass spectrometry. It is a positive ion MALDI MS of the neutral N-linked glycans from ovalbumin released by treatment with PNGase F and recorded using 2,5‑DHB as the matrix. The letters (A-L) indicate identified peak structures.
如要继续阅读,请登录或创建帐户。
暂无帐户?