Allergenic Fragrance Testing – New Certified Reference Materials and GC-FID/GC-MS Application
Markus Obkircher1, Hanspeter Sprecher2, Leonard Sidisky3, Kathleen H. Kiefer4, Matthias Nold5
1Head of Reference Materials R&D, 2R&D Senior Scientist, 3Gas Separations R&D Manager, 4Principal Scientist, 5Global Product Manager Reference Materials

Last year, the International Fragrance Association (IFRA) published a new method1 for the testing of 57 potentially allergenic fragrance compounds in response to an opinion by the European Scientific Committee on Consumer Safety (SCCS), which also proposed to correspondingly amend EC regulation No. 1223/2009.
This new analytical method has been developed by the IFRA Analytical Working Group to identify and to quantify the 57 fragrance substances and their relevant isomers at a concentration higher than 0.002% (20 mg/kg) in ready to inject fragrance materials and oils using Gas Chromatography with FID (GC-FID) or with Mass Spectrometry (GC-MS) detection. This new method will allow the screening of complex fragrance mixtures for the presence of these chemically defined allergens
In this article we will discuss the introduction of new certified reference materials and their analysis by GC using an ionic liquid column as an alternative with unique selectivity and stability as compared to traditional wax/PEG phases.
New Certified Reference Material (CRM) Mixtures
We are proud to introduce two ready-to-use certified reference material mixtures suitable for use as calibrants for the above mentioned new IFRA method. The individual substances of these two mixes consist of a range of compound classes (predominantly of alcohol and carbonyl components), which were all individually thoroughly characterized and their content determined by quantitative nuclear magnetic resonance (qNMR) spectroscopy. qNMR is a relative primary method, as the signal intensity is proportional to the number of protons contributing to the resonance. It is therefore possible to directly compare the signal intensities of an analyte via an internal reference standard to a NIST SRM being a different compound. The individual qNMR certifications were all performed following the well-established qualification workflow developed in Buchs, Switzerland, according to the ISO/IEC 17025 accreditation.
This workflow typically starts with a series of preliminary investigations such as hygroscopy and volatility of the substances. Further determinations ensure the compatibility of each analyte with the internal standard used for the qNMR measurements.
Since reliable weighing values are mandatory, having a direct influence on the result, they are performed in a metrological way. Using a micro-balance in a specific, dedicated setup is the key to success because less sensitive equipment will lead to higher uncertainty contributions deriving from the weighing procedure. This is of the utmost importance for these components as they often have relatively low boiling points. In the qNMR measurements, a value for the mass fractions (g/g) was obtained, and direct traceability to the SI unit was achieved through the use of acknowledged NIST primary reference materials. In addition, early insight into the homogeneity and stability of the components could be gained. If signals of interest of different isomers could not be completely separated in NMR, the ratio was determined by Gas Chromatography (GC) measurement under ISO/IEC 17025 accreditation.
The raw materials were then gravimetrically dissolved and diluted in methyl tert-butyl ether following the ISO 17034 accreditation workflow. Amber glass ampoules were then filled with the resulting bulk solutions
and the process subsequently controlled by GC-MS homogeneity testing.
The final ampoules were thoroughly investigated to guarantee stability throughout the entire shelf life of the product at the storage temperature, as well as during transport to the customer at a potentially higher temperature. In order to be fully compliant with ISO 17034, Long-Term Stability studies (LTS) as well as Accelerated Stability Tests (AST) were performed by GC-MS.
The results from stability testing, from the conducted homogeneity experiments, and from the qNMR measurements themselves all contribute to the overall uncertainty budget that is included individually for each component in the certificate. In addition to the certified values of the concentrations and their respective overall expanded uncertainties in g/kg and g/L (through a certified density measurement at 20 °C), the certificate contains the lot number, an expiry date, intended use, accreditation stamps, and signatures of the producing and releasing chemists.
To guarantee a suitable solution for the customer, the mixtures were intensively tested in a series of interlaboratory comparison studies before the launch.
Table 1 shows product numbers and composition of the two mixes.
* Compounds deviate from the nominal concentration of 2000 mg/kg
GC-FID and GC-MS Application
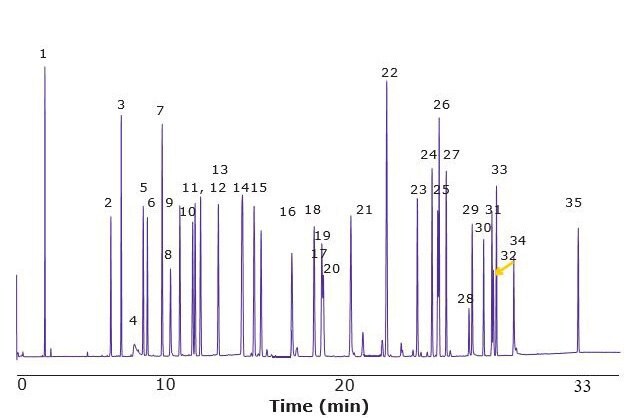
In the following, the separation of the allergens of both mixes using an ionic liquid phase column is demonstrated. The chromatograms shown below have been generated using a polar phase SLB®-IL60i, which provides wax/PEG like polarity with unique selectivity.
Unlike the wax/PEG column (Figure 1) there is minimal baseline rise when this polar column is used
(Figures 2 & 3). The new IFRA methodology1 discusses FID (higher concentrated samples) and MS use; therefore, the figures below show the bleed behavior of the SLB-IL60i for GC-FID (Figure 2) and GC-MS (Figure 3).

Figure 1.GC-MS Chromatogram of Mix A1 on a typical PEG phase column
Experimental
Two fragrance allergen samples Mix A1 (Figure 2) & Mix A2 (Figure 3) were dissolved in MTBE (100 µL/mL) and analyzed by GC-FID or GC-MS using SLB®-IL60i ionic liquid column applying the conditions in Tables 2 and 3.

Figure 2.GC-FID Separation of Mix A1 on a SLB®-IL60i Column
Peak IDs
|
|
|---|

Figure 3.GC-MS of Fragrance Allergen Mix A2 on a SLB®-IL60i Column
Peak IDs
|
|
|---|
Results and Discussion
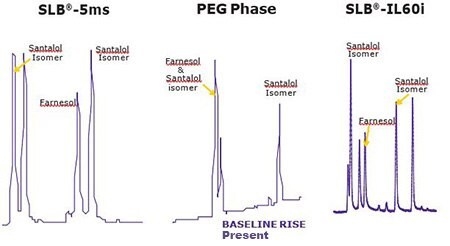
Figures 2 & 3 show the unique separation of the two Fragrance Allergen Mixes on a SLB®-IL60i. Both chromatograms show minimal baseline rise and unique selectivity. Figure 4 shows the separation of farnesol and santalol isomers in Fragrance Allergen Mix A1 on the SLB -IL60i compared to other commonly used columns (methods not shown here). The ionic liquid phase provides the best selectivity to separate these compounds.

Figure 4.Comparison of Santalol & Farnesol Separation on 3 column phases
Summary
With the two new ready-to-use Certified Reference Materials, fragrance manufacturers and testing labs are being provided with reliable, high quality standard calibration solutions suitable for the new IFRA method. This is a major advancement in improving the safety of personal care products and allowing manufacturers to retain their customer's trust.
For the GC analysis the SLB®-IL60i ionic liquid phase column is an alternative to the traditional capillary columns used for fragrance analysis, providing unique separation patterns and often fewer co-elutions (will be demonstrated in a later article). It shows a significantly reduced column bleed compared to traditional polar columns like PEG/wax phases.
Reference
Per continuare a leggere, autenticati o crea un account.
Non hai un Account?