Dual-Labeled Probes in Digital PCR
Digital PCR (dPCR) is an end-point PCR method that is used for absolute quantification and for analysis of minority sequences against a background of similar majority sequences, e.g., quantification of somatic mutations. When using this technique, the sample is taken to limiting dilution (more accurately, partitioned) and the number of positive and negative reactions is used to determine a precise measurement of target concentration.
The sample is partitioned into some cases as many as a million or more reaction chambers, some of which contain one copy of the target nucleic acid molecule (positive), and some of which do not contain a copy (negative)—positive and negative are also described as "1" and "0," respectively, hence "digital."
This article begins with a basic overview of digital PCR and ends with a case study of how our Dual-Labeled Probes performed against those of a competitor as tested by a customer.
Overview
When performing conventional PCR, the final concentration of template is proportional to the starting copy number and the number of amplification cycles. One experiment of a given number of reactions is performed on a single sample and the result is an analysis of fragment sizes or, for quantitative real-time PCR (qPCR), the analysis is an estimate of the concentration of the target sequences in the reaction-based on the number of cycles required to reach a quantification cycle (Cq). When using dPCR, the sample is separated into a large number of reaction chambers, such that each partition contains either one or no copies of target (Figure 1, Table 1). The number of reaction chambers or partitions varies between systems, from several thousand to millions. The PCR is then performed in each partition and the amplicon detected using a fluorescent label such that the collected data are a series of positive and negative results. In theory, this would result in a positive signal from a partition that originally contained a single copy of target and a negative (i.e., no signal) from one that did not originally contain template. However, since it is possible that some partitions will contain more than a single copy of template, the dispersal of the sample into the partitions is considered to obey Poisson distribution.
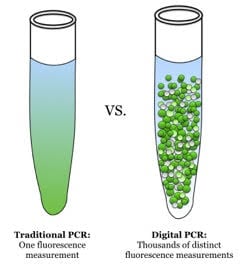
Figure 1. Traditional PCR (qPCR) vs dPCR. With qPCR, one fluorescence measurement is made whereas with dPCR, many such measurements are made (source: Wikimedia Commons). End-point PCR products are often analyzed by non-fluorescent methods, e.g. colorimetric detection.
In theory, dPCR can be used to overcome some of the difficulties that are encountered when using conventional PCR. When using dPCR, a sample is partitioned so that individual nucleic acid molecules within the sample are localized into many separate regions and therefore detection of any target is not dependent on the number of amplification cycles. This approach results in a much more sensitive differentiation of fold change than that afforded by qPCR; a well-optimized qPCR may differentiate 1.5-fold changes at best, whereas dPCR has been reported to differentiate 1.2-fold.1 The dilution of sample makes this a useful tool for studying minority sequences against a majority of similar but differing sequences. For example, dPCR can be used to detect a low incidence somatic single nucleotide polymorphism (SNP) against a high concentration of WT sequence. This is because, when the total sample is partitioned, the rare sequence is also partitioned to a single copy, so it will be amplified in the absence of competition from the prominent sequence. Far fewer partitions will contain a positive for the rare SNP than for the WT, so it is possible to make an accurate measurement of the ratio of the two sequences.
Digital PCR has many potential applications, including the detection and quantification of low-level pathogens, rare genetic sequences, copy number variations (CNVs) and relative gene expression in single cells. Clonal amplification enabled by single-step dPCR is a key factor in reducing the time and cost of many of the “next-generation sequencing” methods, hence enabling personal genomics.
Primers & Probes
Though the reaction format and instrumentation needed varies, dPCR uses the same primers and probes as qPCR.
Figure 2 highlights the method of action of Dual-Labeled (hydrolysis) Probes, the most common detection chemistry.
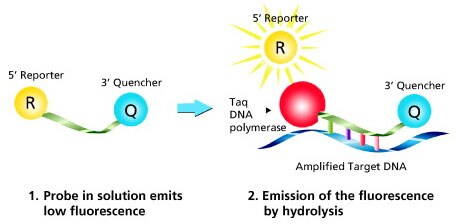
Figure 2. Mechanism of Dual-Labeled Probes. Taq DNA polymerase extends the primer situated on the same strand as the probe until it reaches the probe position. The inherent exonuclease activity hydrolyzes the probe from 5’ to 3’, which releases the reporter dye into solution and thereby causes an increase in fluorescence. The measured fluorescence signal is directly proportional to the amount of target DNA.
Data Analysis
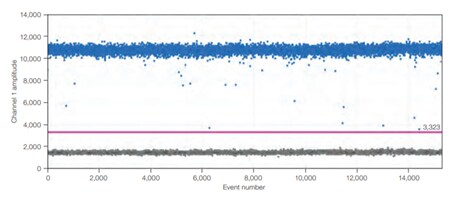
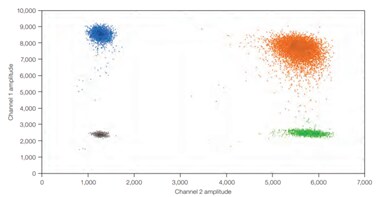
Both end-point PCR and qPCR detect the amplification of the target nucleic acid molecule ensemble present in the sample, which is one reaction chamber (Figure 3). In dPCR, the sample is partitioned into many reaction chambers (droplets), each of which either does or does not have one copy of the target nucleic acid molecule (Figure 4).
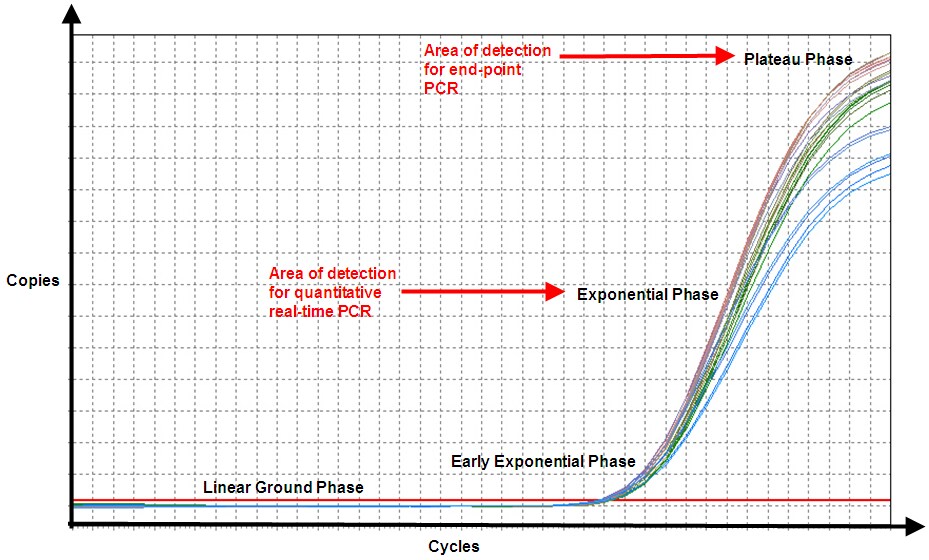
Figure 3. In end-point PCR, reaction products from the plateau phase are detected, and as can be seen, replicates of the sample (same amount of starting nucleic acid) produce different amounts of end product because of variation in the reaction kinetics. In qPCR, even though efficiency is never 100%, the product is nearly doubling with every cycle in the exponential phase, and hence, the reaction is more specific and precise (point of detection in qPCR is determined by the threshold line, which is not shown).
A)
B)
Figure 4.In dPCR, the ratio of positive to negative reactions is used to calculate the absolute quantity of target nucleic acid molecule present in the original sample before it was partitioned for analysis. Therefore, reaction kinetics are irrelevant to the final analysis. A) An example one-dimensional, one-plex reaction. Black dots are droplets without the target present (no fluorescence detected), and blue dots are droplets with the target present (fluorescence detected). B) An example two-dimensional, two-plex reaction. Black dots are droplets without the target present (no fluorescence detected), blue dots are droplets with the first target present (fluorescence from the first reporter dye detected), green dots are droplets with the second target present (fluorescence from the second reporter dye detected), and orange dots are droplets with both targets present (fluorescence from both reporter dyes detected).
Case Study
A well-known life science research tools company compared the performance of our Dual-Labeled Probes with various changes in configuration, e.g. different quenchers, as well as against the probes of a competitor in a battery of dPCR tests. All experiments were performed on a Bio-Rad QX200 Droplet Digital™ PCR (ddPCR™) System.
Thermal Modifications
The first test (Figure 5) compared our probes with and without Locked Nucleic Acid against those of a competitor labeled with a different thermal modification, Minor Groove Binder (MGB).

A)

B)

C)
Figure 5. Detection of wild-type (L137) and mutant (L137I) BRCA1. A Our probes without Locked Nucleic Acid in a two-plex reaction with wild-type and mutant. B) Our probes with Locked Nucleic Acid in a two-plex reaction with wild-type and mutant. C) Competitor probes with MGB in a two-plex reaction with wild-type and mutant. Black dots are droplets without the target present (no fluorescence detected), blue dots are droplets with mutant present (6-FAM™/BHQ™-1, our probes in A and B; 6-FAM/NFQ [non-fluorescent quencher], competitor probes), green dots are droplets with wild-type present (HEX™/BHQ™-1, our probes; VIC™/NFQ, competitor probes), and orange dots are droplets with both mutant and wild-type present. The drop in signal with HEX is because the sample was read on the VIC channel.
Our probes detected 113.3 wild-type copies and 343 mutant copies per microliter, whereas the competitor probes detected 112.1 and 342, respectively. The equivalence of our probes vs. that of the competitor is evident as is the requirement that a thermal modification, such as Locked Nucleic Acid, is present to discriminate between SNPs.
HEX vs. ATTO-532
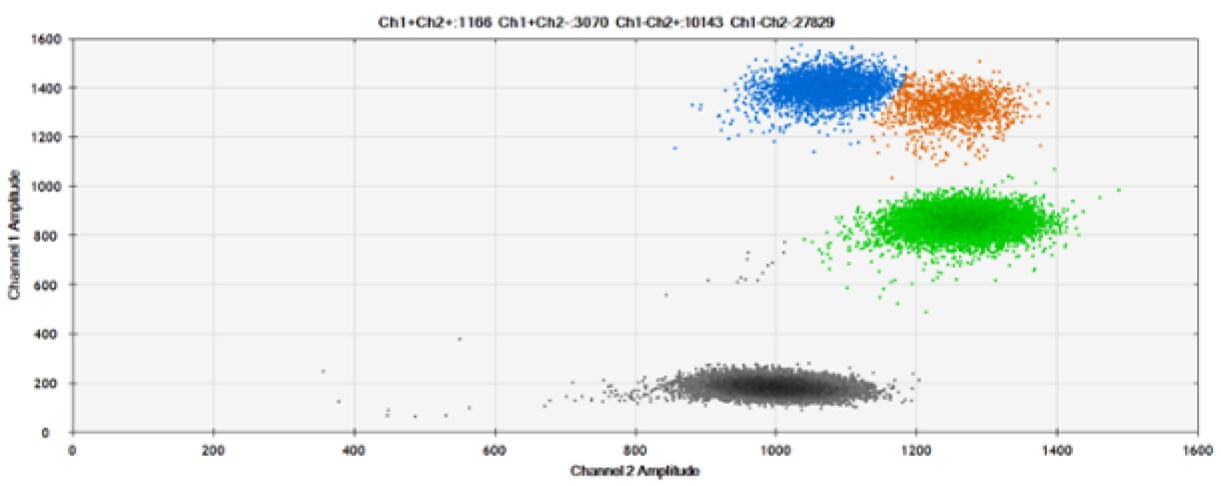
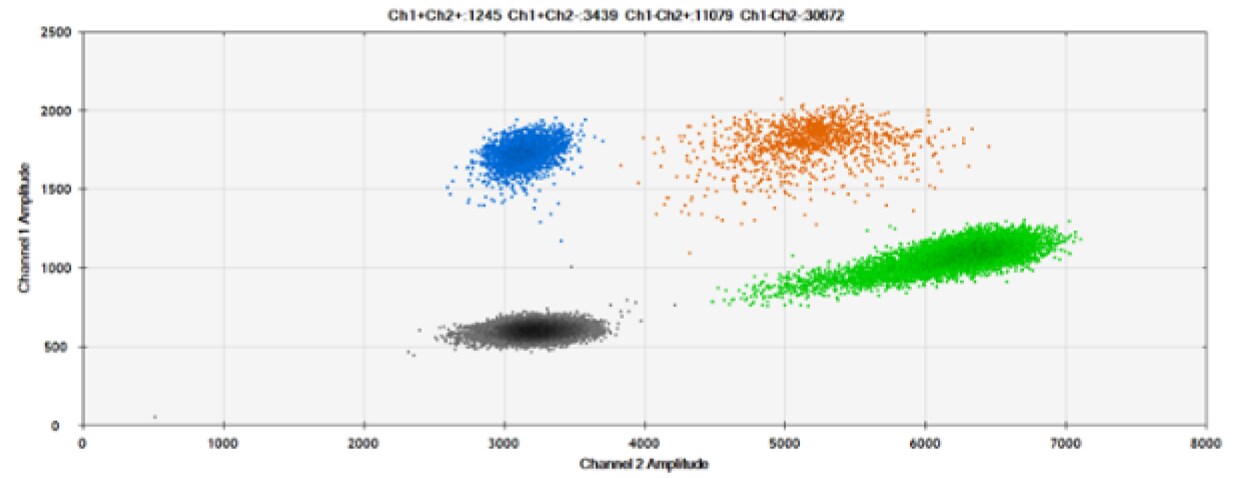
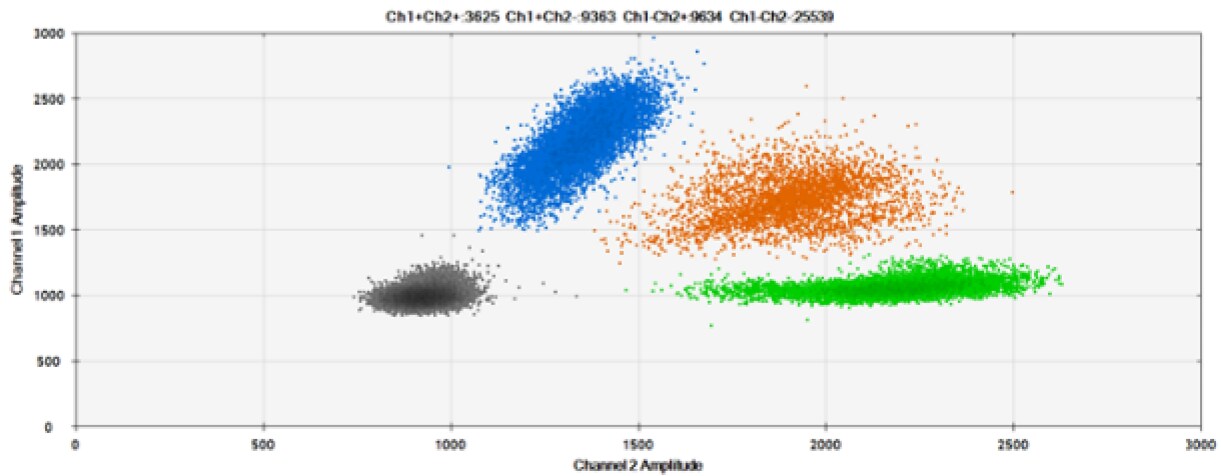
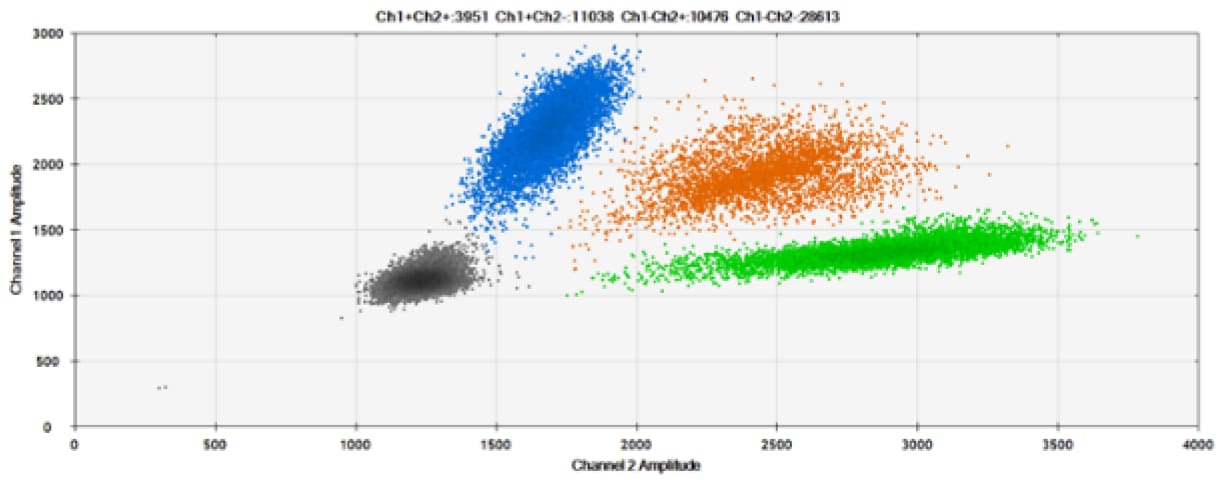
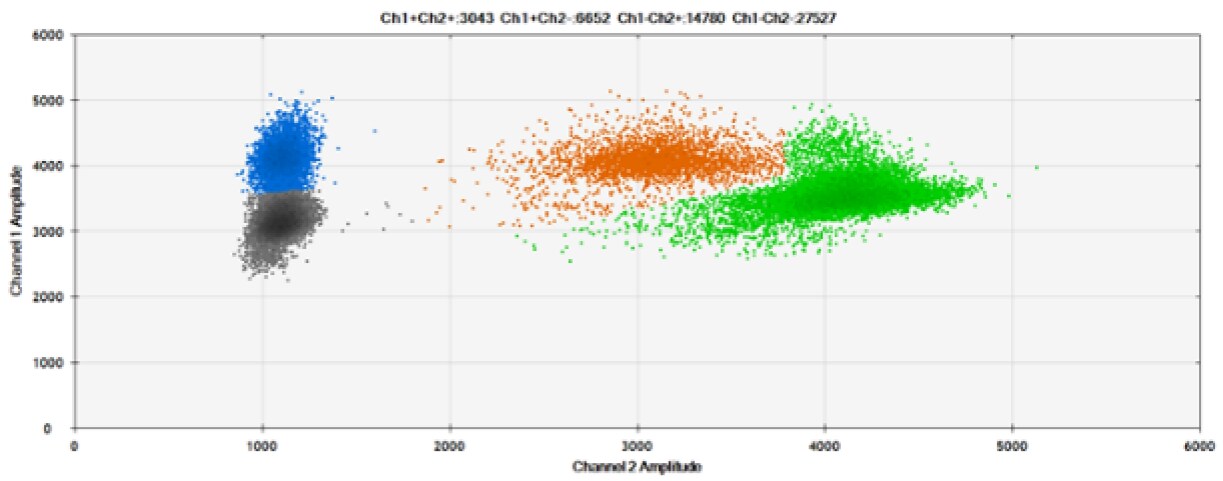
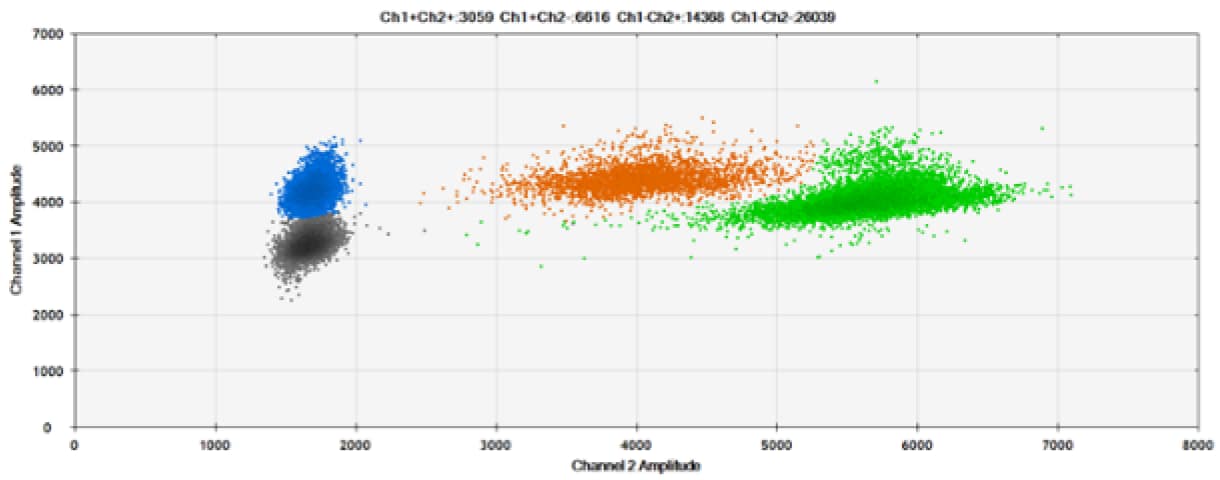
The second test (Figure 6, Table 2) compared our probes with HEX reporter dye and an alternative to HEX, ATTO-532.
A)
B)
C)
D)
E)
F)
Figure 6. Detection of BRCA1 L137I, ERBB2 A775_G776insYVMA, and PDGFRA S566-E571>Rdel. A & B) Our probes with HEX/BHQ™-1 and ATTO-532/BHQ™-1, respectively, against BRCA1 L137I. C & D) Our probes with HEX/BHQ™-1 and ATTO-532/BHQ™-1, respectively, against ERBB2 A775_G776insYVMA. E & F) Our probes with HEX/BHQ™-1 and ATTO-532/BHQ™-1, respectively, against PDGFRA S566-E571>Rdel. Black dots are droplets without the target present (no fluorescence detected), blue dots are droplets with mutant present (6-FAM/BHQ™-1), green dots are droplets with the wild-type present (HEX/BHQ™-1 or ATTO-532/BHQ™-1), and orange dots are droplets with both mutant and wild-type present. All probes contain Locked Nucleic Acid.
*Coefficient of Variation
ATTO-532 appears to provide similar performance when compared against HEX. However, there is a limited body of literature with such comparisons. Therefore, we recommend that those interested in using ATTO-532 in dPCR to perform additional experiments to determine if it meets performance requirements.
Fluorescent vs Non-Fluorescent Quencher
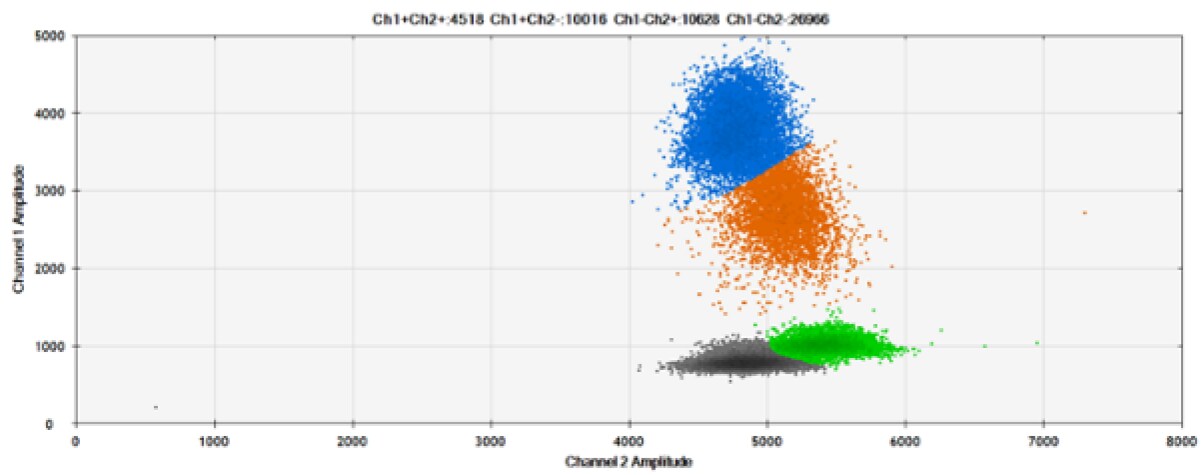
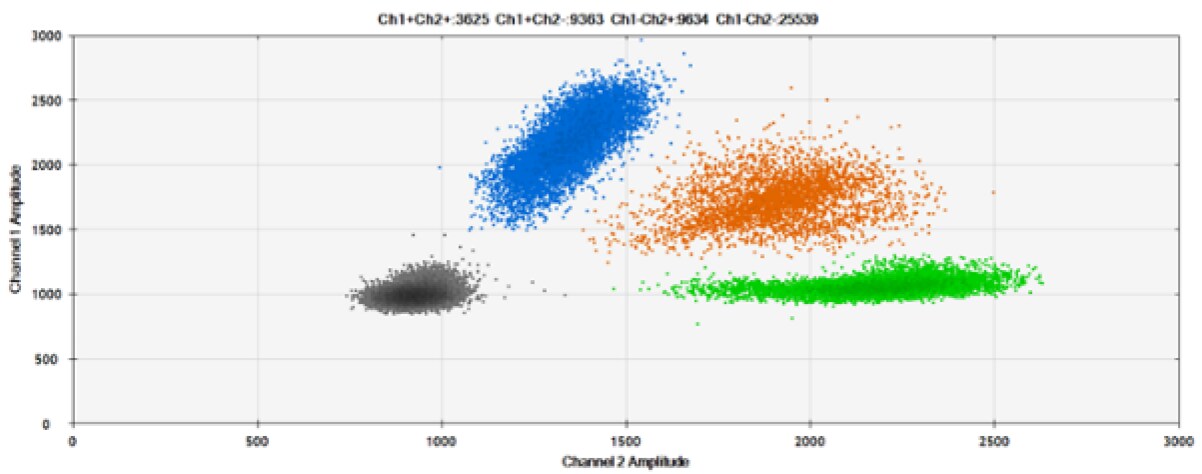
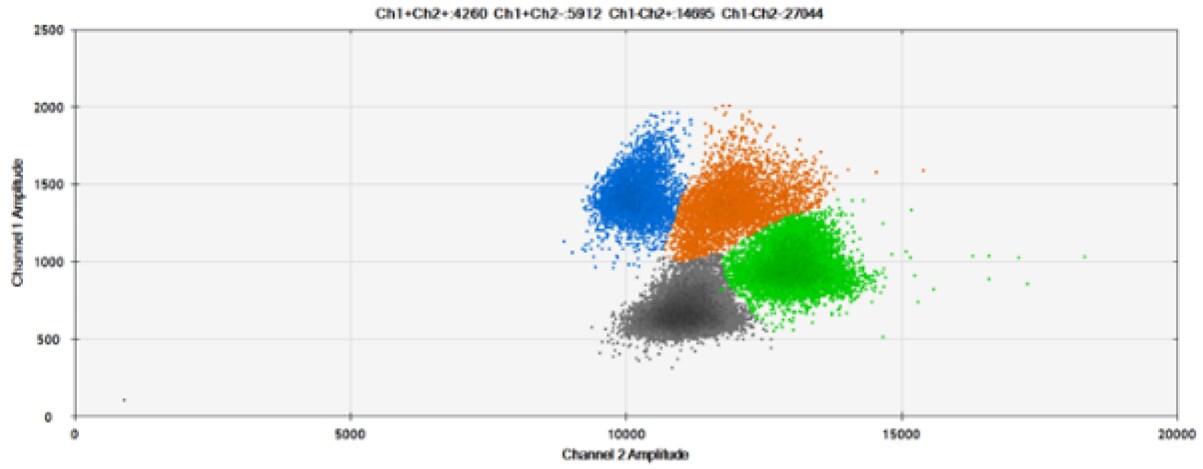
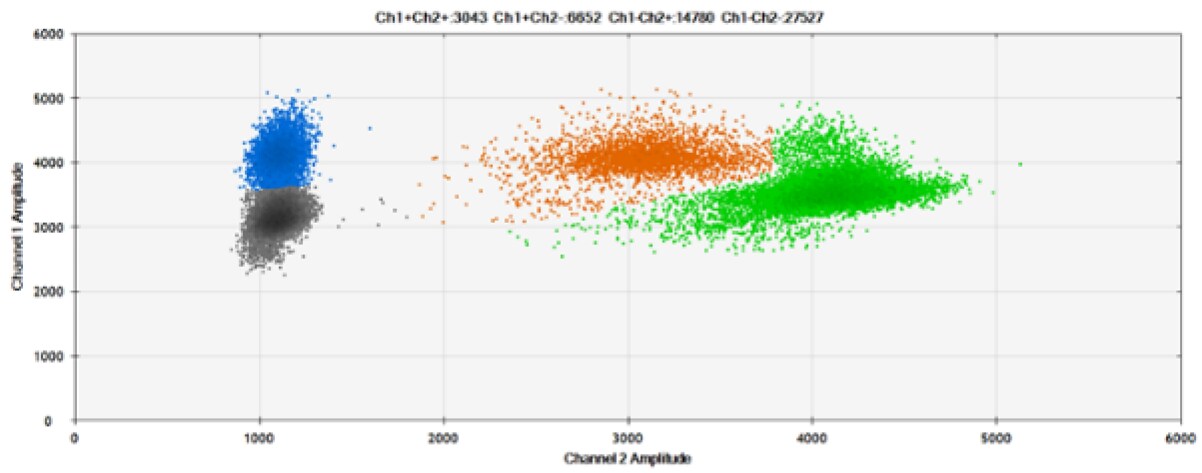
The third test (Figure 7, Table 3) compared our probes with TAMRA and BHQ™-1 as quencher to determine if one or both would be sufficient compared to the performance of the competing NFQ (also called a DQ or Dark Quencher).
A)
B)
C)
D)
Figure 7. Detection of ERBB2 A775_G776insYVMA and PDGFRA S566-E571>Rdel. A & B) Our probes with TAMRA and BHQ™-1, respectively, against ERBB2 A775_G776insYVMA. C & D) Our probes with TAMRA and BHQ™-1, respectively, against PDGFRA S566-E571>Rdel. Black dots are droplets without the target present (no fluorescence detected), blue dots are droplets with mutant present (6-FAM), green dots are droplets with the wild-type present (HEX), and orange dots are droplets with both mutant and wild-type present. All probes contain Locked Nucleic Acid.
*Coefficient of Variation
As expected from published qPCR experiments and seen here, BHQ™-1 provides better separation of fluorescence signals than TAMRA in two-plex reactions with 6-FAM and HEX.
Dark Quencher vs. Dark Quencher
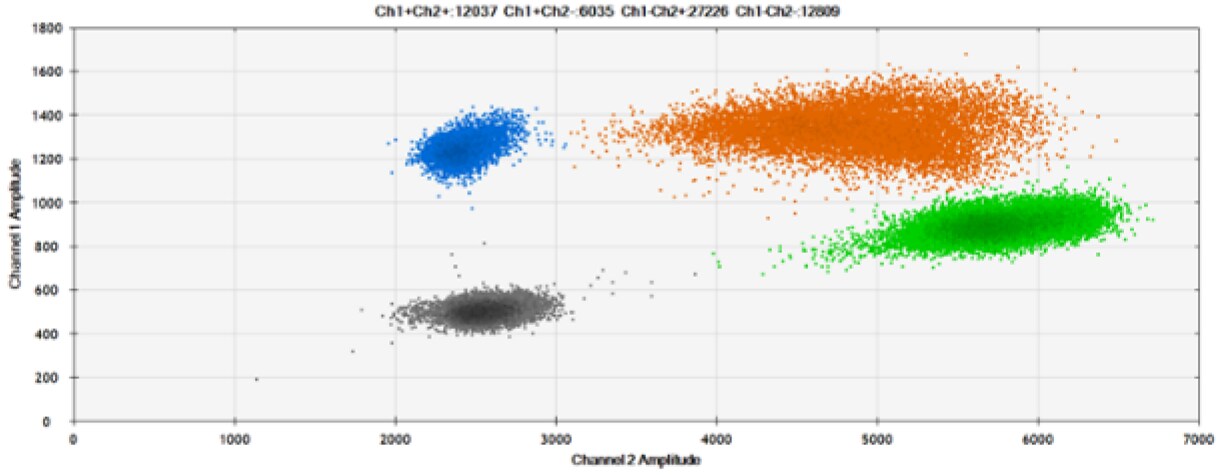
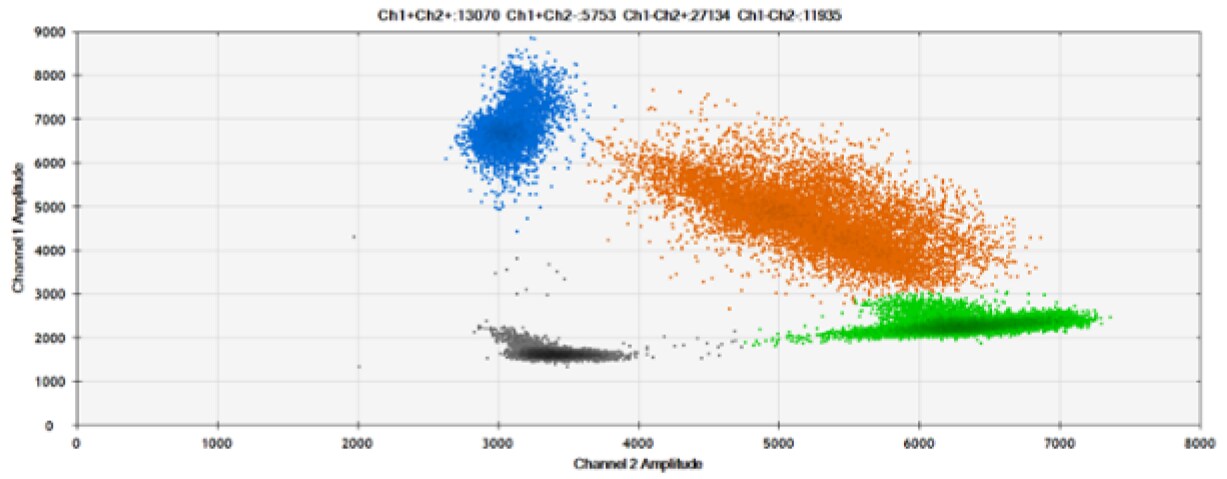
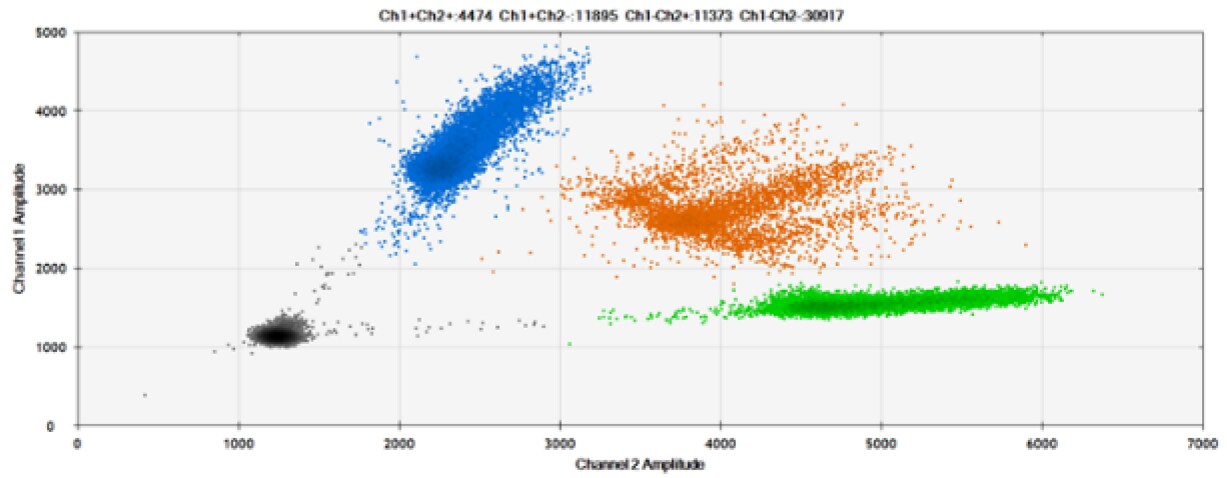
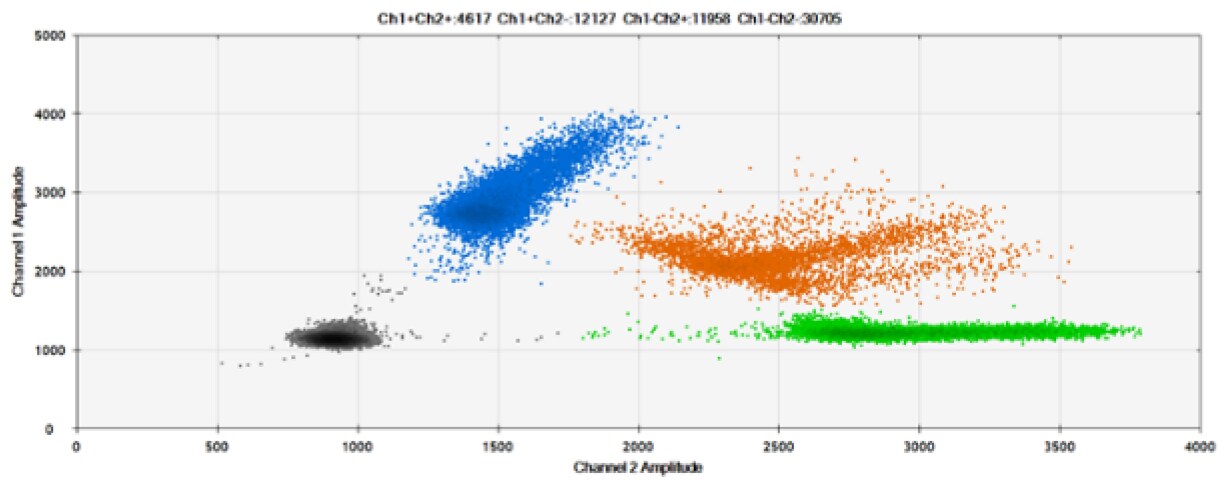
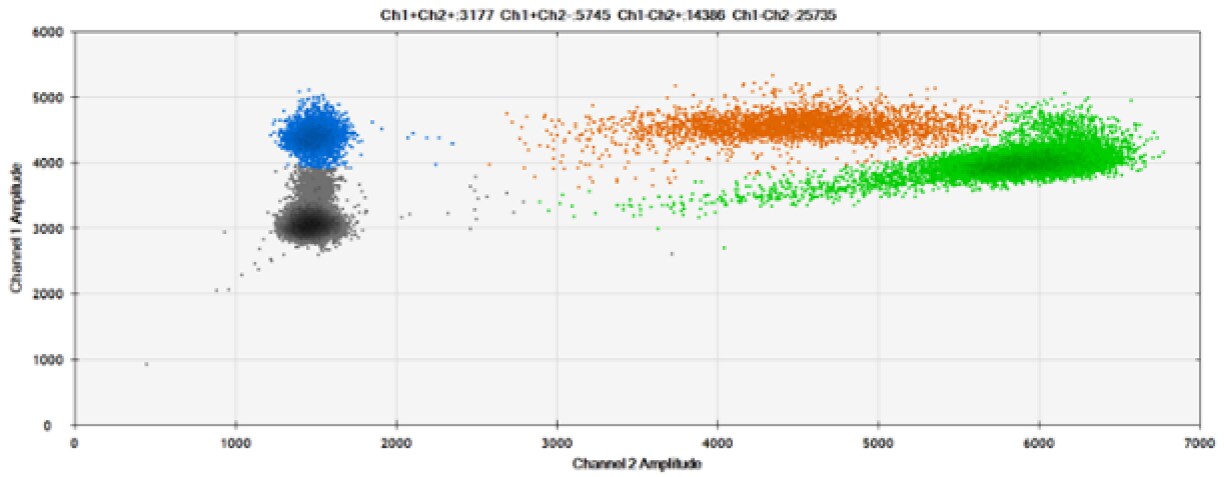
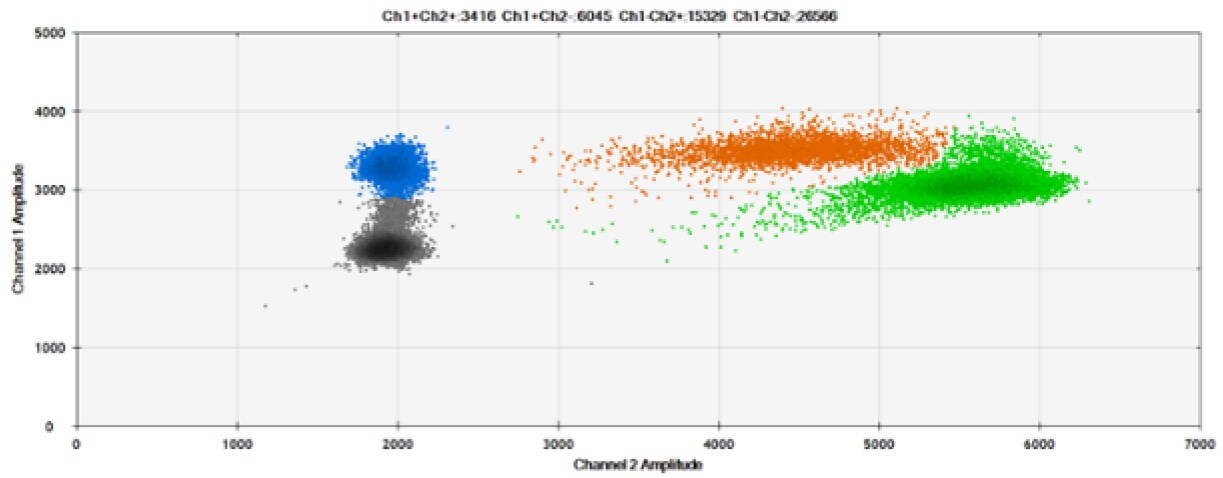
The fourth test (Figure 8, Table 4) compared our probes with BHQ™-1 and OQ™ (Onyx Quencher™), our own license and royalty-free non-fluorescent (dark) quencher.
A)
B)
C)
D)
E)
F)
Figure 8. Detection of BRCA1 L137I, ERBB2 A775_G776insYVMA, and PDGFRA S566-E571>Rdel. A & B) Our probes with BHQ™-1 and OQA, respectively, against BRCA1 L137I. C & D) Our probes with BHQ™-1 and OQA, respectively, against ERBB2 A775_G776insYVMA. E & F) Our probes with BHQ™-1 and OQA, respectively, against PDGFRA S566-E571>Rdel. Black dots are droplets without the target present (no fluorescence detected), blue dots are droplets with mutant present (6-FAM), green dots are droplets with the wild-type present (HEX), and orange dots are droplets with both mutant and wild-type present. All probes contain Locked Nucleic Acid.
*Coefficient of Variation
OQA provides equivalent quenching performance when compared against BHQ™-1. Given that OQ is available license and royalty free, it is an attractive option to consider when commercialization of dPCR probes is the goal.
SNP Detection
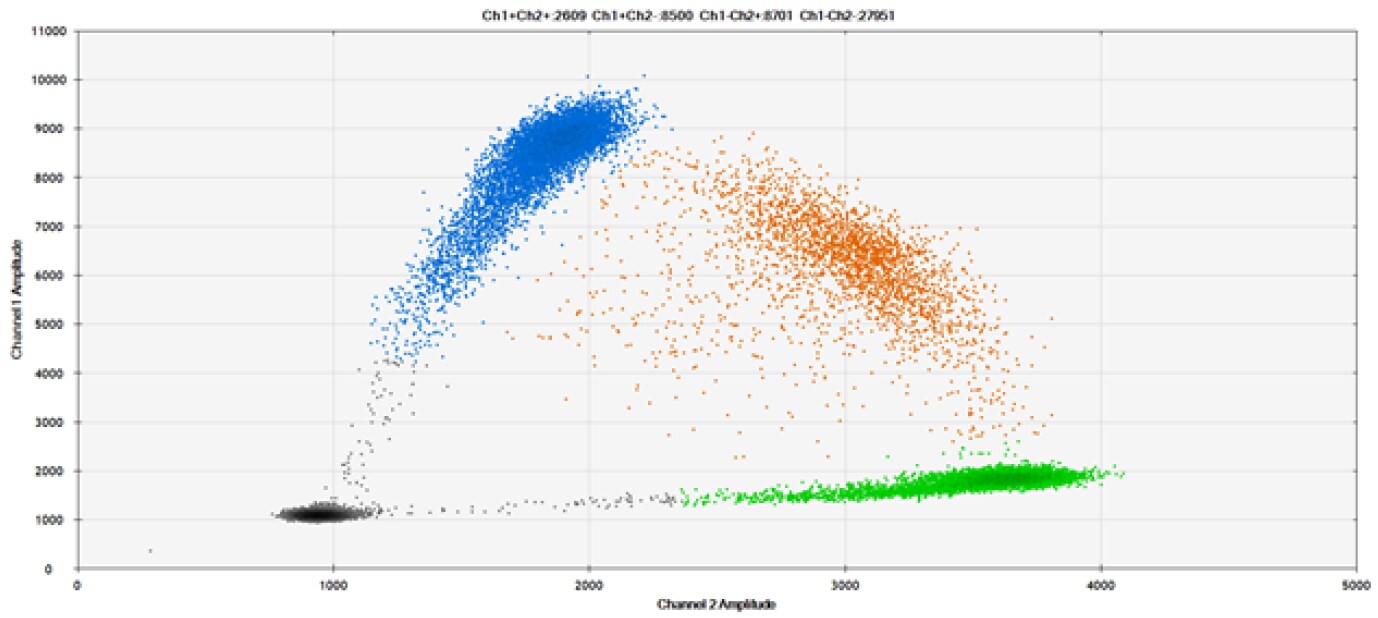
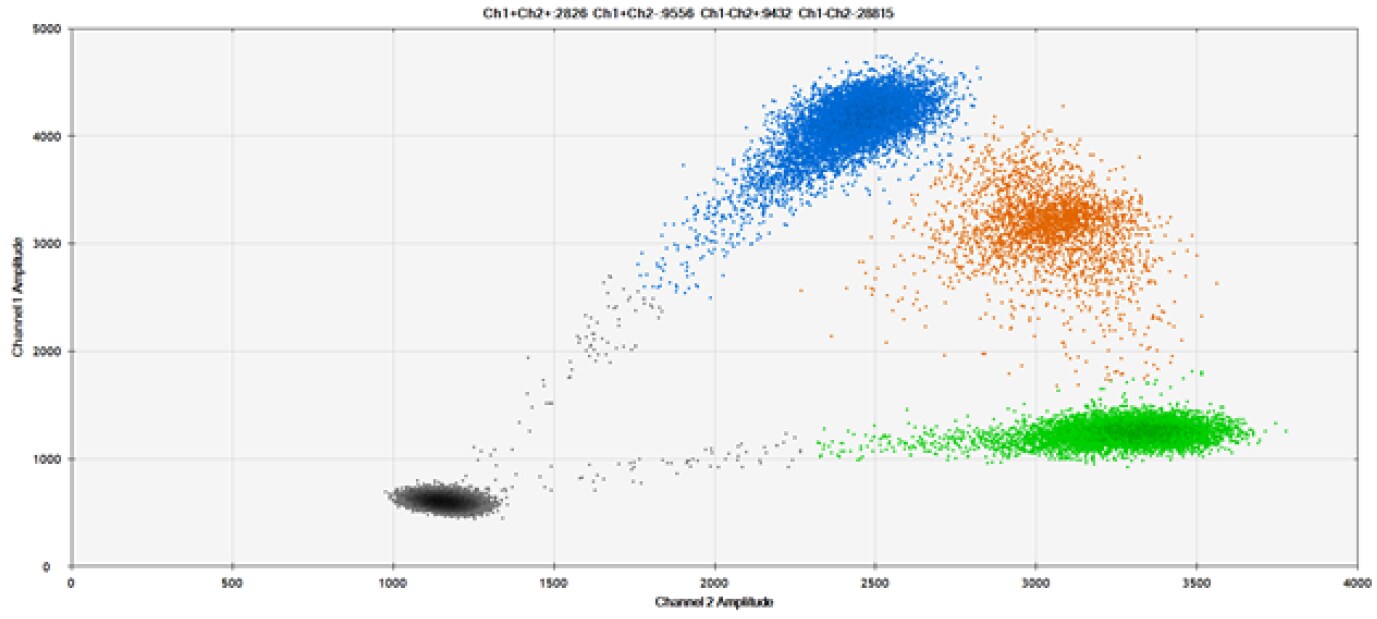
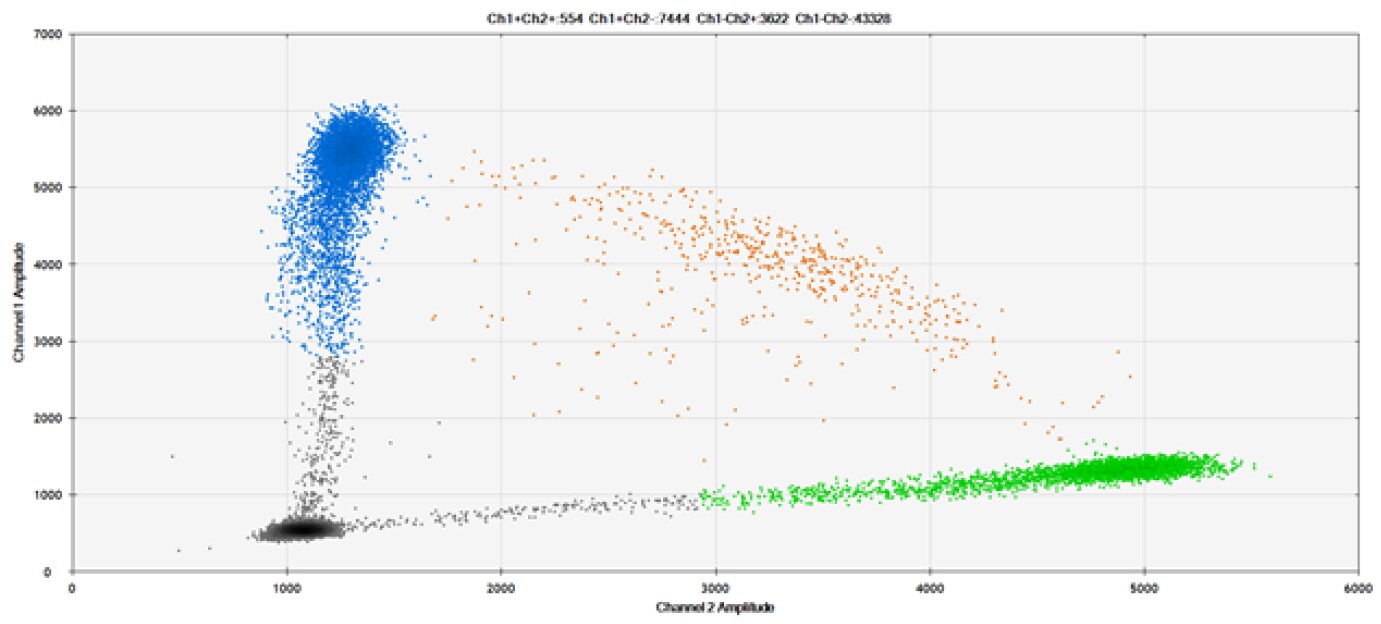
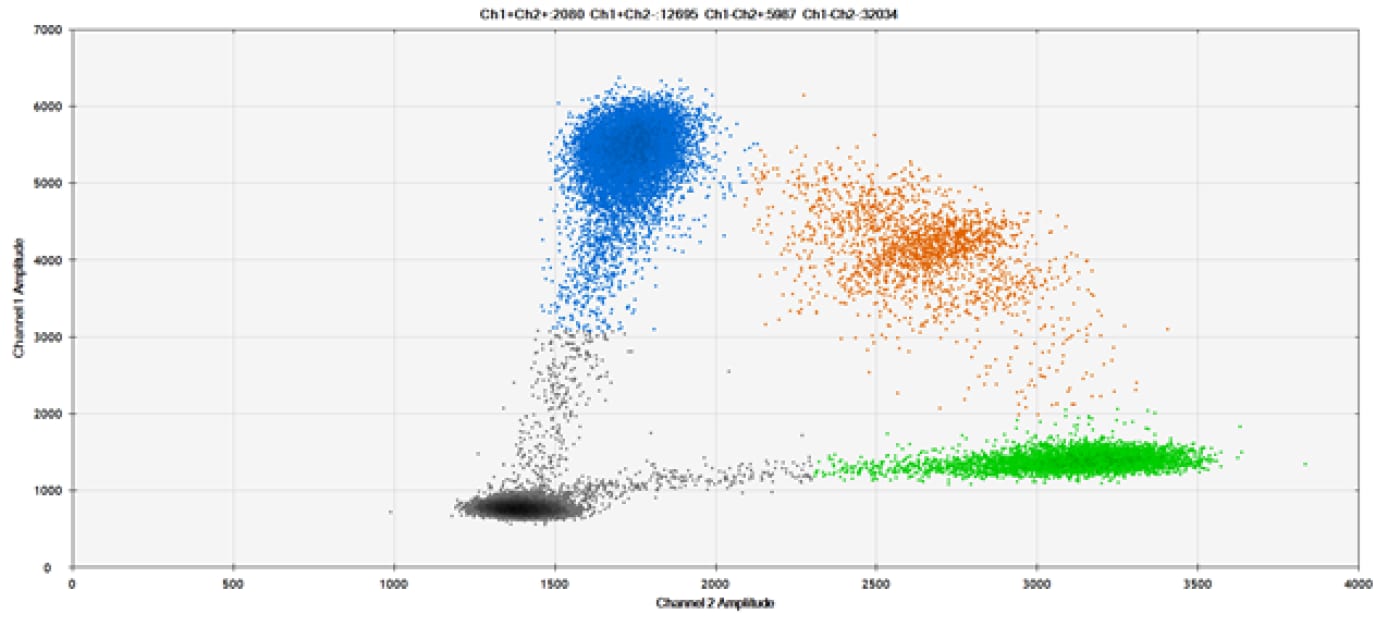
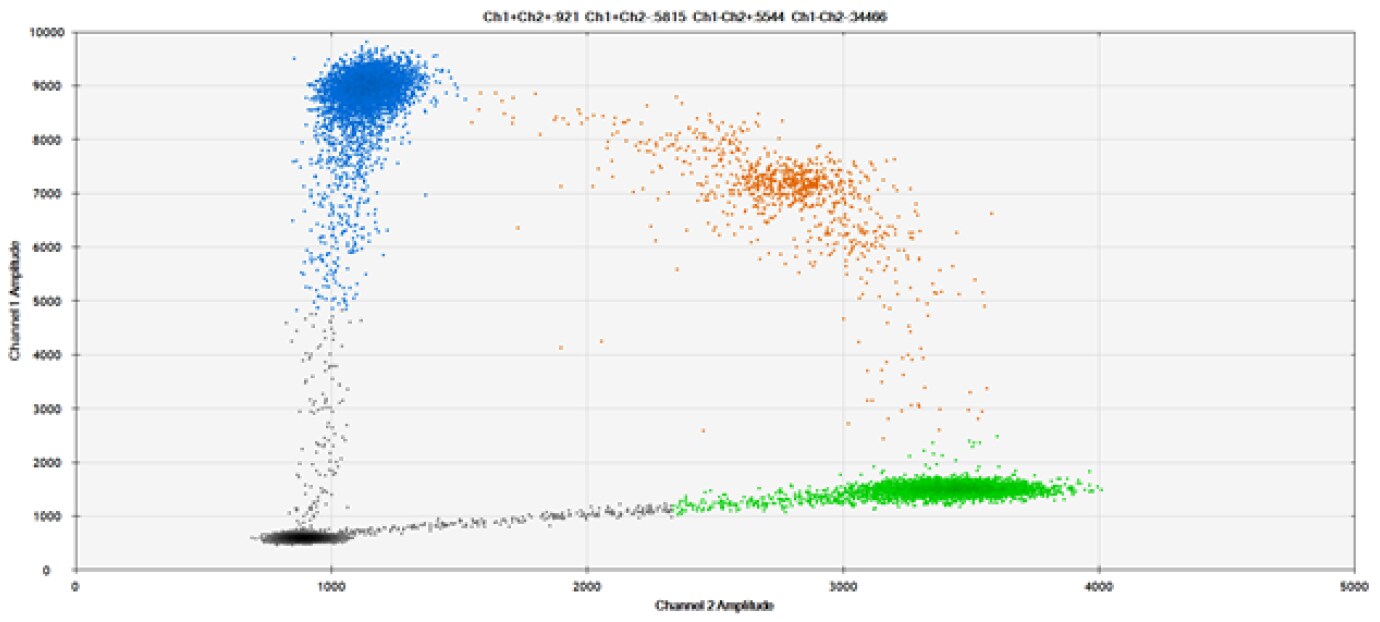
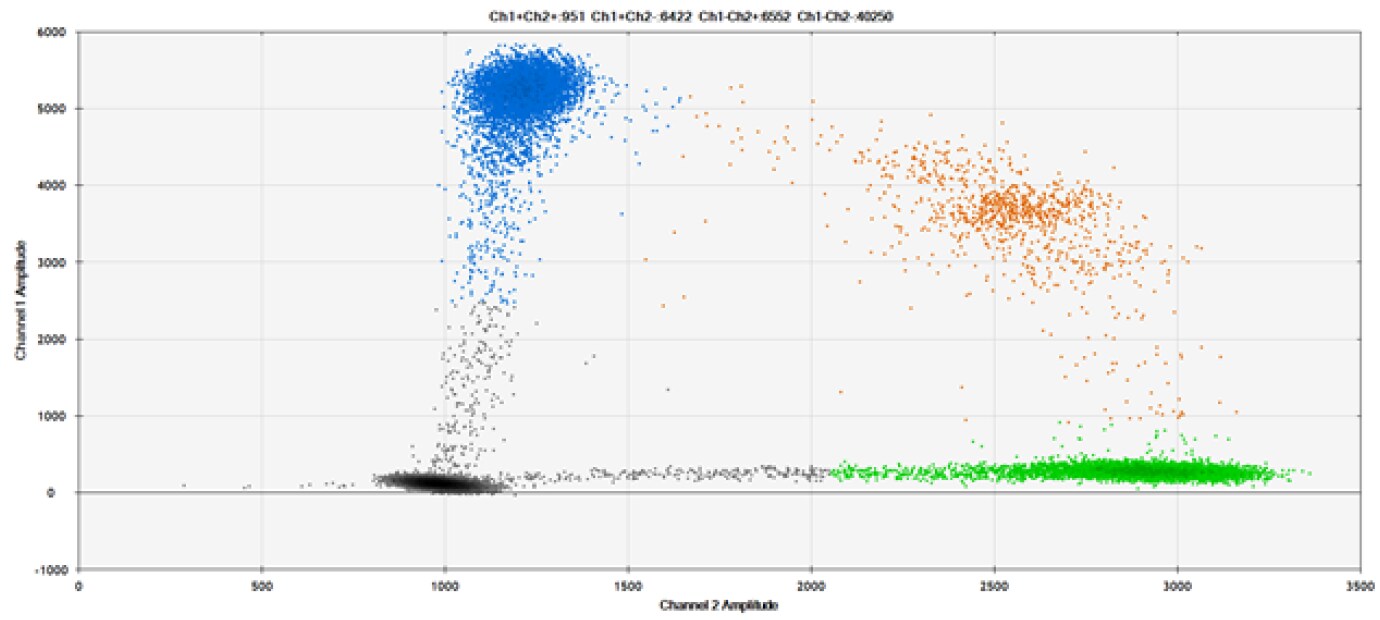
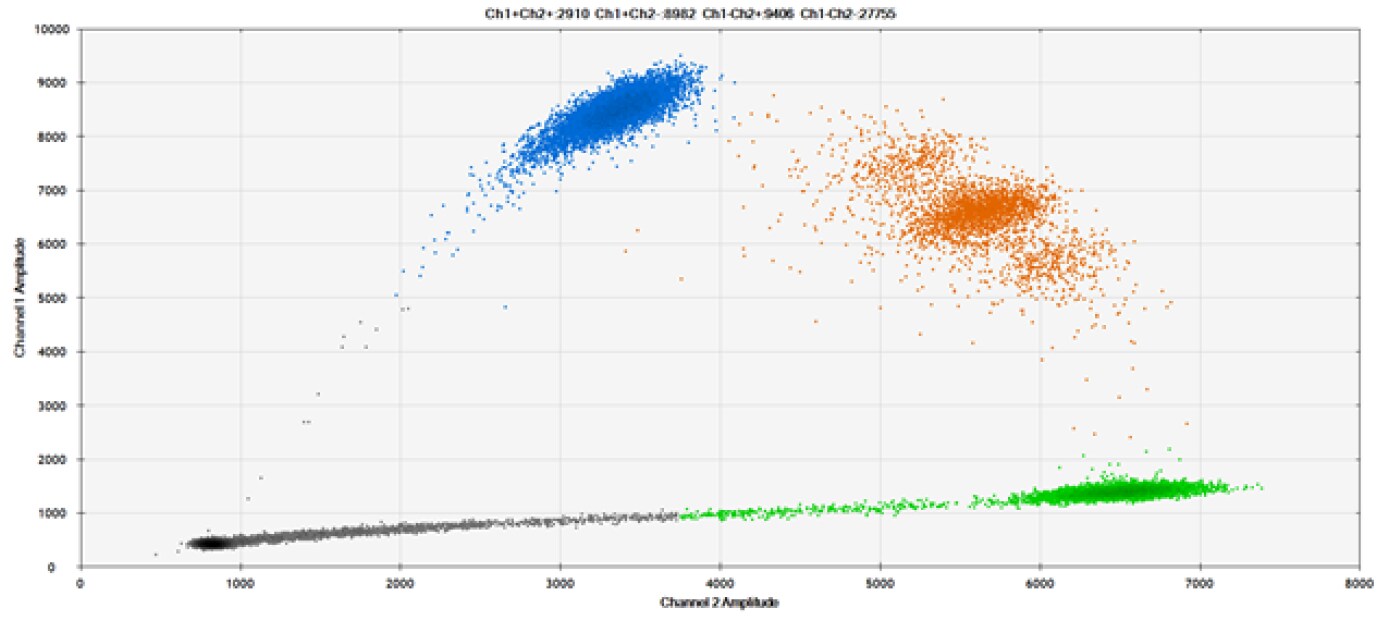
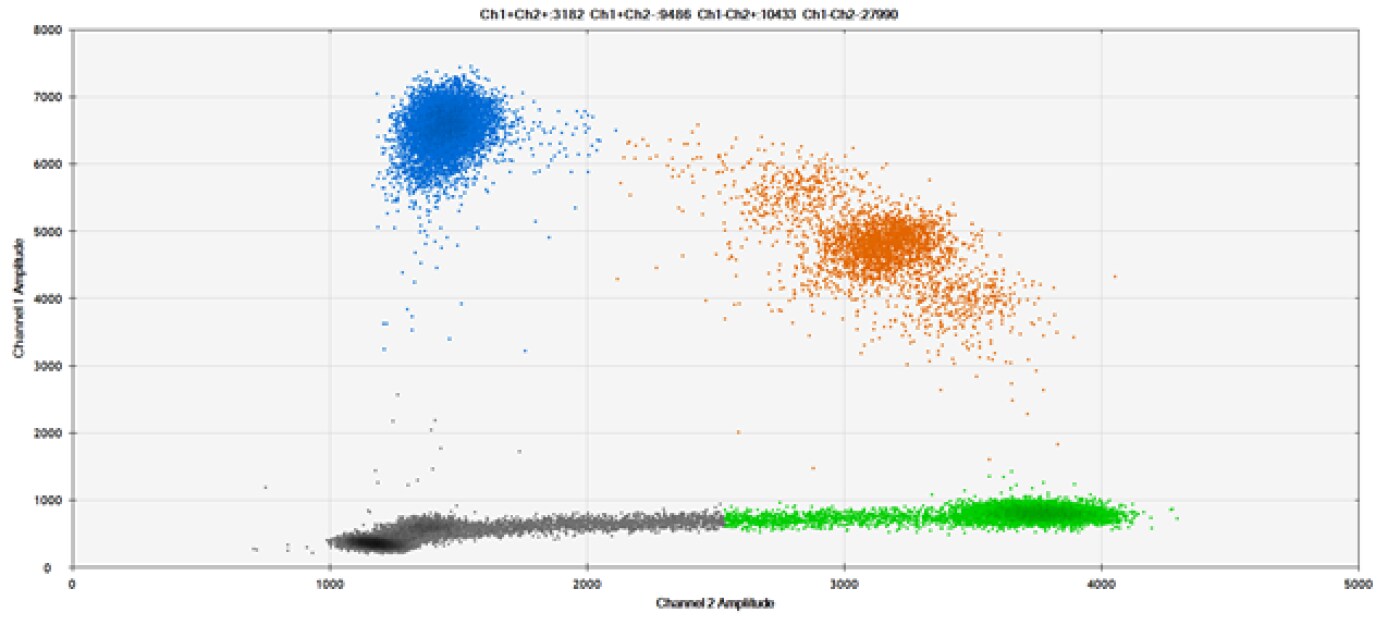
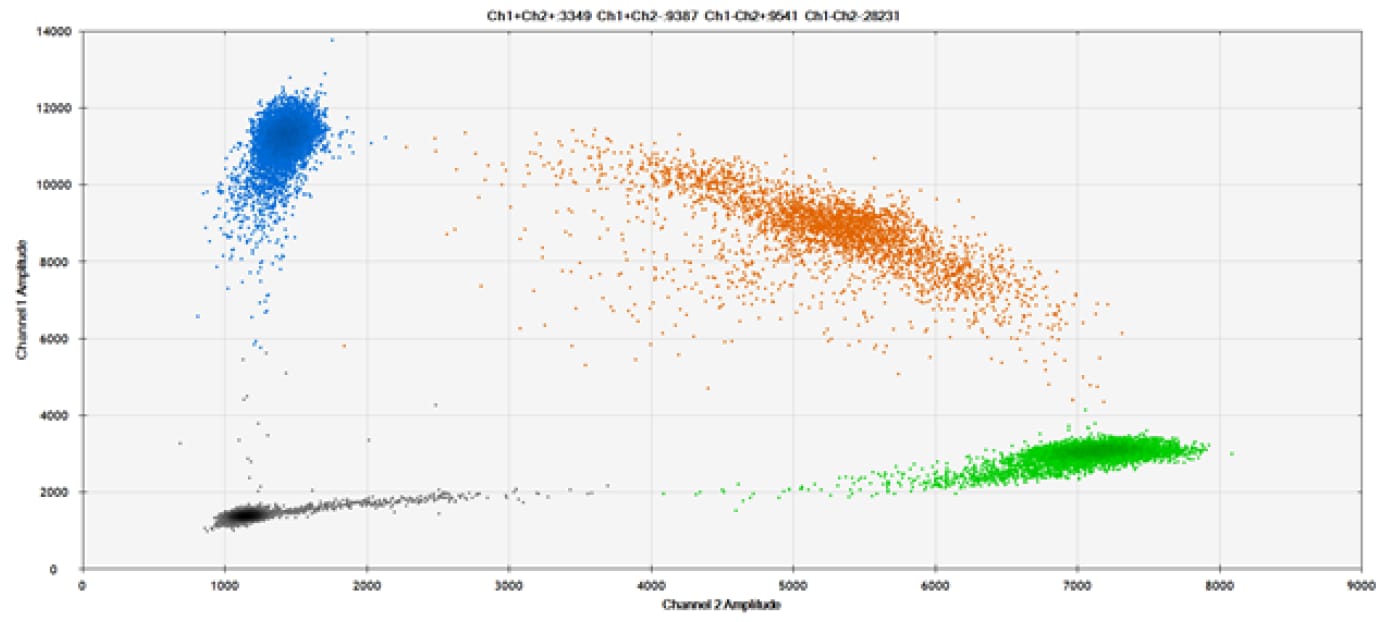
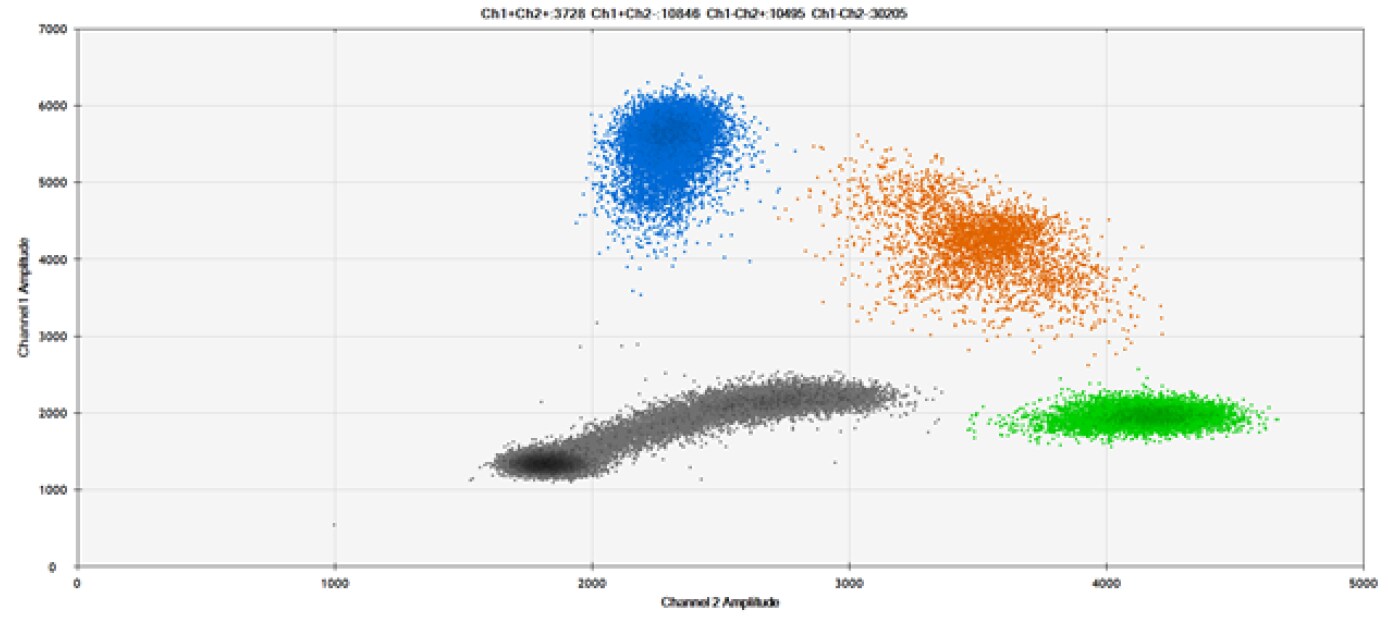
The fifth and final test (Figure 9 and associated tables) compared our probes against those of a competitor for detection of SNPs in common target genes.
A)
*Coefficient of Variation
B)
*Coefficient of Variation
C)
*Coefficient of Variation
D)
*Coefficient of Variation
E)
Figure 9. Detection of SNPs in several common target genes. A) Our (top) and competitor (bottom) probes against AKT1 E17K B) Our (top) and competitor (bottom) probes against BRAF V600E C) Our (top) and competitor (bottom) probes against EGFR L858R D) Our (top) and competitor (bottom) probes against KRAS G12D E) Our (top) and competitor (bottom) probes against PIK3CA E545K. Tables include measured concentrations and Allelic Frequency (AF). Genomic DNA is at 50% AF for wild-type and mutant. Black dots are droplets without the target present (no fluorescence detected), blue dots are droplets with mutant present (6-FAM™/BHQ™-1, our probes; 6-FAM/NFQ, competitor probes), green dots are droplets with the wild-type present (ATTO-532/BHQ™-1, our probes; VIC/NFQ, competitor probes), and orange dots are droplets with both mutant and wild-type present. Our probes contain Locked Nucleic Acid, and competitor probes contain MGB.
*Coefficient of Variation
Our probes labeled with Locked Nucleic Acid and alternative reporters / quenchers perform comparably to those of a popular brand.
Conclusion
Our Dual-Labeled Probes perform well in dPCR when compared against a popular brand. If possible, follow these guidelines when setting up an experiment:
- Locked Nucleic Acid is required for detection of SNPs, but it may not be necessary for CNV (copy number variants) and gene expression analysis
- ATTO-532 might be a suitable replacement for HEX
- TAMRA should be avoided as a quencher
- OQ is comparable to BHQ™ in quenching
Both online and consultative design options are available. If additional help is needed, please consult our technical services group at oligotechserv@sial.com.
References
如要继续阅读,请登录或创建帐户。
暂无帐户?