Analysis of Remdesivir and other Antiviral Drugs Using LC-MS/MS
Introduction
Remdesivir is a broad-spectrum antiviral drug, typically administered through injections. The drug has been tested in 2020 as a treatment for COVID-19, through the WHO Solidarity Trial. Here we present a fast and robust HPLC-MS/MS method that can be used for Remdesivir and three structural antiviral analogues. Indinavir, Nelfinavir, and Saquinavir are protease inhibitors, typically used in the treatment of the human immunodeficiency virus (HIV).
Several different stationary phases were screened through the development process, with the aim to find and provide the best selectivity for the target analytes. The best overall results were achieved with an RP-Amide column, but also C18, AQ-C18 or Phenyl-Hexyl phases can offer appropriate retention and peak shape for Remdesivir. With a short 30x2.1 mm Ascentis® Express RP-Amide stationary phase used in gradient mode it is possible to have all compounds well retained and fully resolved under two minutes. Calibration data for Remdesivir (1-250 ng/mL) display adequate linearity (R2 = 0.9995) with a Limit of detection (LOD) and Limit of quantitation (LOQ) determined as 0.7 and 1.3 ng/mL (95% confidence interval), respectively.
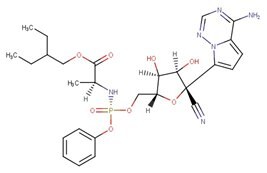
Figure 1.Remdesivir, C27H35N6O8P (CAS No. 1809249-37-3)
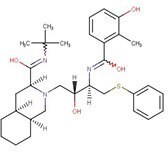
Figure 2.Nelfinavir, C32H45N3O4S (CAS No. 159989-64-7)
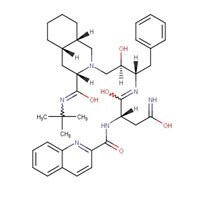
Figure 4.Saquinavir, C38H50N6O5 (CAS No. 127779-20-8)
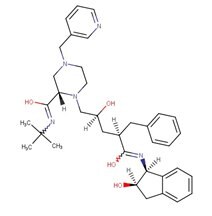
Figure 3.Indinavir, C36H47N5O4 (CAS No. 150378-17-9)
Remdesivir Calibration Data (1-250 ng/mL)
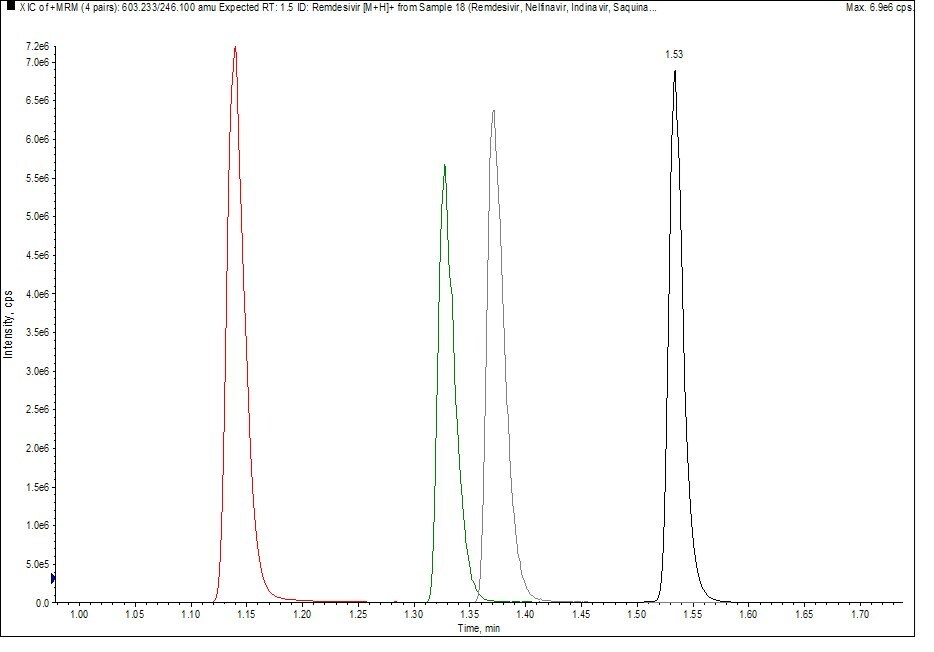
Figure 5.Chromatogram showing the separation of Indinavir, Saquinavir, Nelfinavir, and Remdesivir. An example chromatogram showning the baseline separation of Remdesivir and three related antiviral drugs
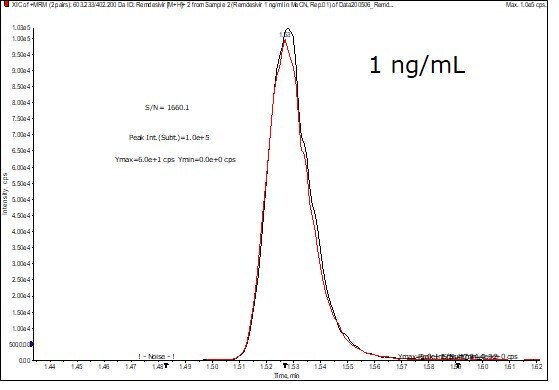
Figure 6.Chromatogram showing the chromatographic response from an injection of 1 ng/mL Remdesivir standard solution. Example LC-MS chromatogram showning the injection of 1 ng/mL standard solution
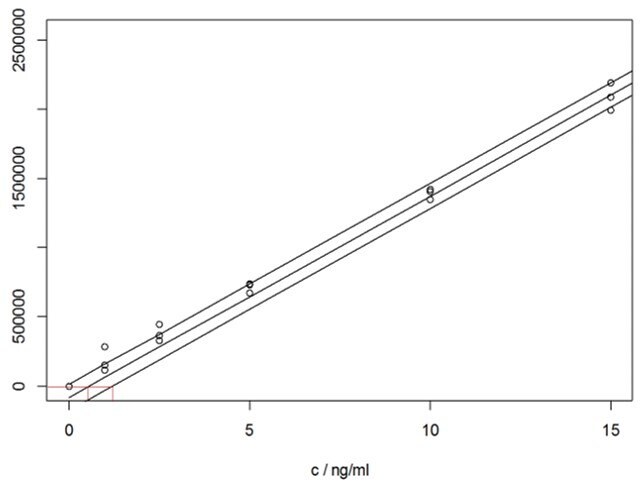
Figure 7.Remdesivir calibration curve data (1-15 ng/mL). Illustration of the calibration curve linearity at the lower Remdesivir concentration range examined in the current study
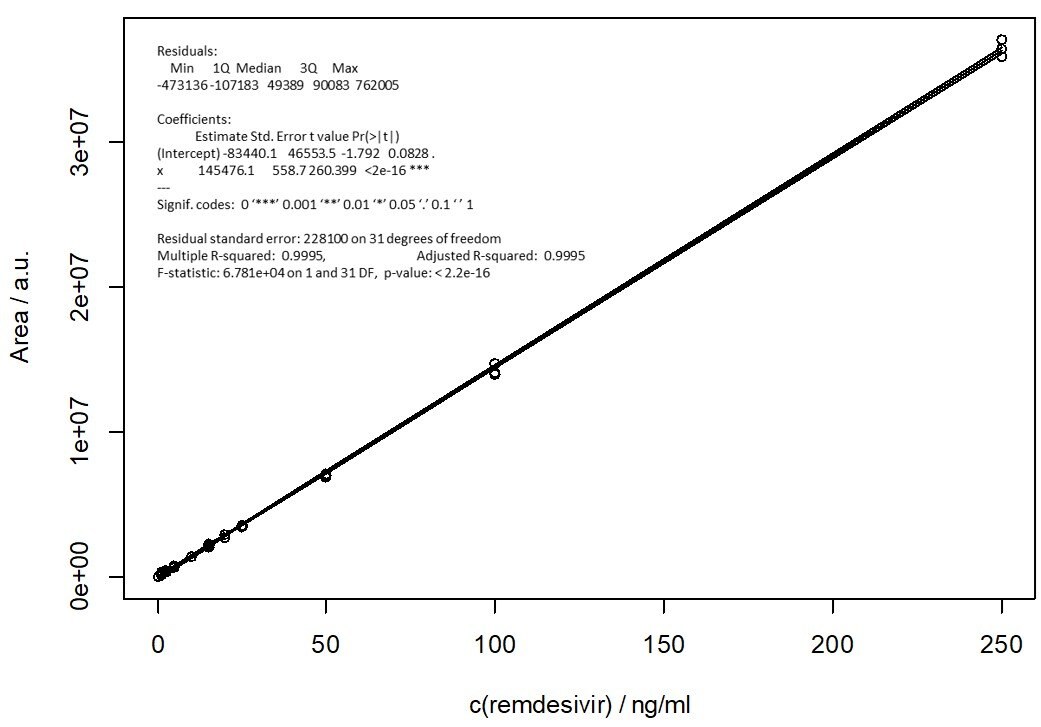
Figure 8.Remdesivir calibration curve data (1-250 ng/mL). Illustration of the full calibration range examined in the current study
如要继续阅读,请登录或创建帐户。
暂无帐户?