Workflow for Cannabinoids Analysis in Cannabis Using Chromolith® Monolithic Silica HPLC Column Providing Low Backpressure and Extended Column Lifetime
Sunil Badal, Senior Scientist1, Benjamin Peters, Lab Head2, Uma Sreenivasan, Head of Reference Materials R&D1
1Round Rock, USA, 2Instrumental Analytics R&D, Darmstadt, Germany
Analysis of Cannabinoids in Cannabis and Hemp Products
The legal use of recreational and medical cannabis is expanding globally along with growth in hemp-based products, based on cannabidiol, for health and wellness. Hemp is defined legally in various geographies as cannabis varieties with limits on total tetrahydrocannabinol (THC) content. Cannabis and hemp products need to be tested to determine accurate potency of the active cannabinoid constituents to ensure consumer safety. Cannabis products on the market range from plants to distillates, and edibles to cosmetics. This broad variety of matrices underscores the need for robust columns and high throughput analytical methods.
This work provides a complete HPLC-DAD (high performance liquid chromatography - diode array detection) workflow for cannabinoids analysis using robust Chromolith® monolithic silica HPLC columns with low column back pressure. Chromolith® monolithic silica HPLC columns enable fast and cost-efficient separations due to low column backpressure and the very high robustness of the column. The low backpressure allows very fast separation with high flow rates at same solvent consumption per sample. The workflow offers the following:
- Detailed hemp bud sample preparation for HPLC-UV analysis.
- Fast and cost-efficient separation with Chromolith® monolithic silica HPLC columns with low back pressure to determine potency of hemp bud sample.
- Demonstration of robustness of Chromolith® column.
- Separation of 14 cannabinoids within 10 minutes.
- Calibration curve preparation using certified reference materials (CRMs).
Chemical Structure of 14 Cannabinoids
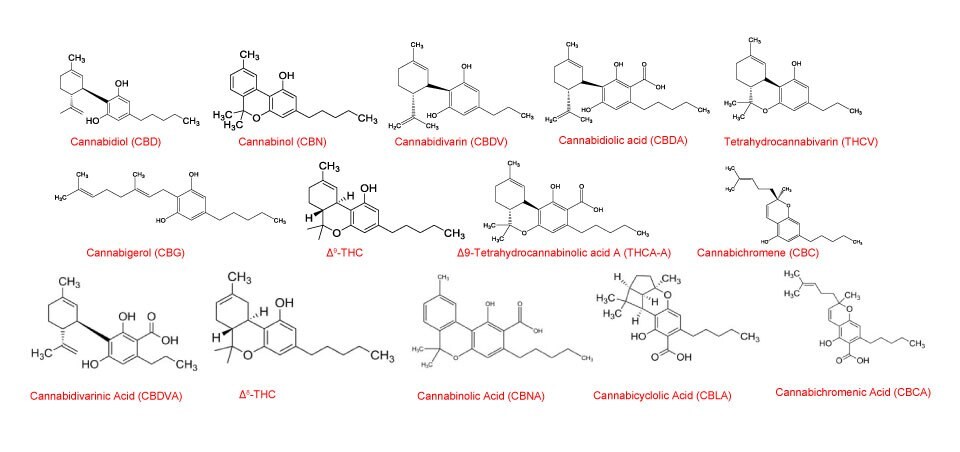
There are more than 100 distinct cannabinoids that have been isolated from cannabis. Delta9-Tetrahydrocannabinol (∆9-THC) is the primary psychoactive compound and cannabidiol (CBD) is another major non-psychoactive constituent in cannabis. Structures of ∆9-THC, CBD, and some other cannabinoids analyzed by the method described here are shown in Figure 1.

Figure 1.Chemical structures of fourteen cannabinoids studied in this study.
Experimental Procedure for Cannabinoid Analysis in Hemp and Cannabis
In this work, hemp bud samples were analyzed to determine their potency. Sample preparation involved ethanol extraction of cannabinoids from plant material. The extract was then analyzed applying an HPLC-UV method and using a Chromolith® monolithic silica HPLC column. Quantitation was performed utilizing a 6-point calibration curve obtained from HPLC-UV analysis of standard solutions prepared from CRMs. Peaks were identified using the retention times from chromatogram of 14 mix cannabinoids. Cannabinoids peaks were also verified by comparing UV absorption spectra of both samples and standards. Furthermore, robustness of monolithic silica based Chromolith® was demonstrated via retention time stability and separation efficiency after 1400 injections.
Preparation of Mobile Phases
For mobile phase A, 0.1% H3PO4 (aq.) was prepared by adding 1 mL H3PO4 to 1000 mL of water. Pure methanol was used as mobile phase B.
Preparation of Standard Solutions
Standard solutions containing six major analytes were prepared using CRMs from Merck as shown in the table below:
Preparation of Peak Identification Solutions
Peak identification solution containing 14 cannabinoids was prepared using CRMs as shown below:
Preparation of Hemp Bud Extract
Cannabinoids were extracted from hemp buds using ethanol extraction as explained below to demonstrate the extraction from plant matrix:
a) Homogenize 1 g hemp bud (particle size < 1 mm). (Low temperature homogenization such as frozen ball-milling is preferred method of homogenization without sample degradation.)
b) Transfer the homogenized sample to a 50 mL polypropylene centrifuge tube.
c) Dispense 20 mL ethanol and vortex for 30 s.
d) Incubate sample on horizontal shaker for 30 mins.
e) Centrifuge sample at 4000 rpm for 5 minutes to pellet plant material.
f) Transfer the supernatant into amber 100 mL volumetric flask and keep the pellet for second extraction.
g) Perform second extraction with 20 mL ethanol and add the supernatant to amber 100 mL volumetric flask containing contents of the first extraction.
h) Fill flask to 100 mL mark with ethanol and mix well.
i) Perform 1:10 and 1:100 dilution of sample with ethanol.
j) Filter samples into HPLC vials with 0.2 µm PTFE membrane. Here, syringeless filter-vials were used.
Subsequent analysis was performed applying a 2 mm I.D. Chromolith® High Resolution HPLC column:
Instrument Parameters
Cannabinoids Separation with Chromolith® Column
Hemp bud sample was homogenized at low temperature to prevent analyte degradation using cryo-cup grinder followed by double extraction with ethanol. Resulting solution was diluted, filtered, and subjected to HPLC-DAD analysis. Calibration curves were obtained by analyzing solutions prepared from CRMs. Cannabinoids in hemp bud extract were identified based on retention time match with standards and cross verified with UV absorption spectra. Results showed that the hemp bud sample contained 7.37% (wt/wt) total CBD and 0.25% (wt/wt) total THC. Stable retention time for cannabinoids was observed during 1400 injections demonstrating the robustness of the column towards a complex matrix like hemp bud extract.
System Suitability: Peak Identification Solutions
CRMs as 1.0 mg/mL or 0.5 mg/mL solutions in methanol or acetonitrile, were used to prepare calibration and peak identification solutions. Separation of 14 cannabinoids was demonstrated with very good resolution and reproducibility (Table 1). Separation of 14 cannabinoids was achieved under 10 minutes (Figure 2).

Figure 2.Chromatogram of 14 cannabinoids mixture obtained with a Chromolith® HR RP18e 50-2mm column at 228 nm (Temperature 40 °C, eluent A: 0.1% H3PO4, eluent B: Methanol, flow rate 0.5 mL/min, injection volume 1 µL, gradient: 62% B for 1 min, 62-90% B in 7 min, hold at 90% B for 2 min).
Calibration Curves
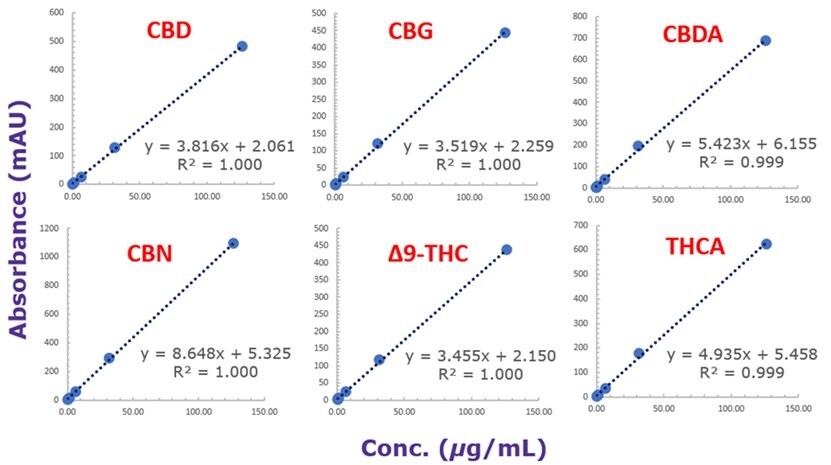
Calibration curves were obtained for six major cannabinoids (CBD, CBG, CBDA, CBN, ∆9-THC, and THCA); see chromatogram in Figure 3. Linearity of R2>0.995 was obtained for all analytes within the range of 0.25-100 µg/mL (Figure 4).

Figure 3.Chromatogram of calibration mixture at 100 µg/mL obtained with a Chromolith® HR RP18e 50-2mm column at 228 nm (Temperature 40 °C, eluent A: 0.1% H3PO4, eluent B: Methanol, flow rate 0.5 mL/min, injection volume 1 µL, gradient: 62% B for 1 min, 62-90% B in 7 min, hold at 90% B for 2 min).

Figure 4.Calibration curves of six cannabinoid analytes obtained with a Chromolith® HR RP18e 50-2mm column at 228 nm (Temperature 40 °C, eluent A: 0.1% H3PO4, eluent B: Methanol, flow rate 0.5 mL/min, injection volume 1 µL, gradient: 62% B for 1 min, 62-90% B in 7 min, hold at 90% B for 2 min). Calibration curve ranges from 0.25 to 100 µg/mL. Linearity: R2 >0.995 for all six analytes.
Results showed that the “as is” hemp bud sample contained 7.37% (wt/wt) total CBD and 0.25% (wt/wt) total THC (Table 2). Stable retention time for cannabinoids was observed during 1400 injections demonstrating the robustness of the column towards a complex matrix like hemp bud extract.

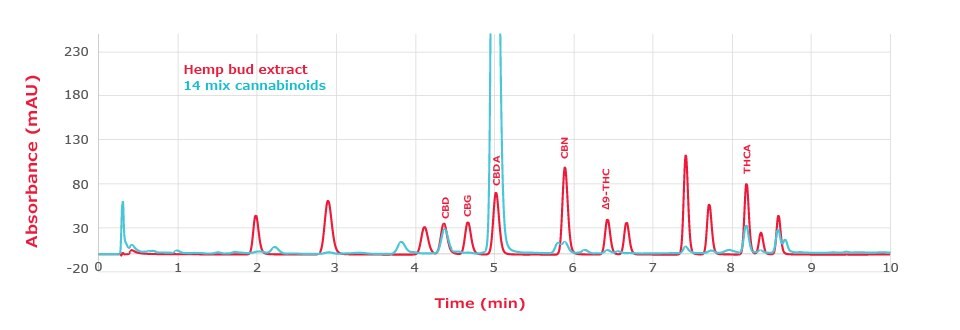
Figure 5.Overlay of chromatograms of peak identification solution and hemp bud extract obtained with a Chromolith® HR RP18e 50-2mm column at 228 nm (Temperature 40 °C, eluent A: 0.1% H3PO4, eluent B: Methanol, flow rate 0.5 mL/min, injection volume 1 µL, gradient: 62% B for 1 min, 62-90% B in 7 min, hold at 90% B for 2 min).
In HPLC-UV analysis, identity of analytes depends on retention times and can be compromised by co-eluting peaks. It is necessary to ensure that no impurity is co-eluting with the peak of interest. Here, we minimized the effects of impurities by comparing the UV absorption spectra of the analytes with those of the standards. As can be seen from Figure 6, most analytes in hemp bud extract display absorption profiles like those of the standard analytes. Among them, CBN seems to contain an impurity which is visible in the chromatogram in Figure 5 as well. This additional verification with UV absorption spectra further ensures the identity of detected analytes.

Figure 6.Overlay of UV spectra from hemp bud sample (Red) and standard solution (Blue) at same retention time for six analytes. Slight differences in CBN spectra between sample and standard might be due to the overlap with another peak as can be seen in Figure 5.
Robustness of Chromolith® Column
The separation of matrix-rich samples, such as herbs, food, or biological samples tends to reduce the column lifetime to particulate columns if no sufficient sample preparation is performed before HPLC separation. Chromolith® monolithic silica HPLC columns allow the separation of matrix-rich samples with extended column lifetime, with no or very reduced sample preparation required before separation. Extended column lifetime and reduced sample preparation will significantly reduce the cost of operation. Figure 7 shows the stability of the retention factor for the analysis of cannabinoids in a hemp sample with a Chromolith® HR RP18e 100-2mm column during 1400 injections. Results demonstrate the robustness of monolithic silica based Chromolith® columns.

Figure 7.Retention factor stability performance test/hemp sample on a Chromolith® High Resolution RP18e 100-2mm (Column temperature of 25 °C, eluent A: 0.1% H3PO4, eluent B: Methanol, flow ate 0.38 mL/min, injection volume 0.2 µL, gradient: 72% B for 0.1 min, 72-90% B in 7 min, hold at 90% B for 3 min).
In between cannabinoid sample analyses, the separation efficiency of the Chromolith® column was tracked with a performance test. Anthracene was used as the analyte and results were compared with those obtained for two other HPLC columns: Ascentis® Express (superficially porous particles-SPP) and Purospher® STAR 2 µm (fully porous particles-FPP) (Table 3). For the CBD retention time comparison, the cannabinoid separation was optimized for the Chromolith® column and was then transferred to Purospher® STAR and Ascentis® Express columns in order to create comparable stability results. No significant change in the CBD retention time is observed after 1400 injections. The efficiency for the monolithic silica based Chromolith® columnonly slightly decreased (2.7%), while for the fully porous and superficially porous, a reduction of 25.3% and 11.3%, respectively, was determined. These results again show the robustness of both bimodal pore structure and rigid monolithic silica skeleton over an extended analysis period.
Conclusion
This work demonstrates an HPLC-DAD workflow, using a monolithic silica based Chromolith® HPLC column, for the determination of cannabinoids in hemp bud samples. Sample homogenization, use of accurate CRMs, separation of 14 cannabinoids with very good selectivity, and robustness of Chromolith® columns are important elements of the workflow. Hemp bud samples were homogenized at low temperature to prevent analyte degradation using a cryo-cup grinder, followed by double extraction with ethanol. Resulting solution was diluted, filtered, and subjected to HPLC-DAD analysis. Calibration curves were obtained by analyzing solutions prepared from CRMs. Cannabinoids in hemp bud extract were identified based on retention time match with standards and cross verified with UV absorption spectra. Results showed that the hemp bud samples contained 7.37% (wt/wt) total CBD and 0.25% (wt/wt) total THC. The robustness of Chromolith® columns was also demonstrated by the analysis of cannabinoids in hemp bud extract, resulting in a stable retention factor during 1400 injections, proving once more the suitability of these columns for matrix-rich samples.
References
Para seguir leyendo, inicie sesión o cree una cuenta.
¿No tiene una cuenta?