RT-PCR / RT-qPCR Troubleshooting
On This Page
- Developing a Troubleshooting Protocol
- Optimizing Oligo Design
- PCR Assay Optimization
- RT-PCR and qPCR Assay Design
- RNA or DNA Template Quality
- Assay PCR Program
- Thermo Cycler Malfunction
- Troubleshooting Examples: Diagnostic Tools
- Dissociation / Melt Curves
- Troubleshooting RT-PCR Case Studies
- Summary — PCR Troubleshooting Checklist
Developing a PCR or RT-PCR Troubleshooting Protocol
Potential Sources of Error and/or Problems Operator Error
There are many possibilities for operator error. The sources of these errors often remain unidentified. The first step in any troubleshooting procedure is to check the protocol and repeat the experiment. Checking the protocol (refer to Appendix A, Protocols, of this guide) and asking an experienced molecular biologist to review the experimental plan is important. The cautionary tale of the postdoctoral fellow who ran several failing PCRs before realizing that the dNTPs were missing from the PCR master mix is a reminder that even the best over-worked scientists are vulnerable to simple errors.
Master Mix
Mistakes or problems with the master mix blend of reaction components may be the source of a catastrophic failure of amplification in all samples and positive controls. Before repeating the experiment, check all components and their concentrations. If a new batch of reagent is being used, it is a useful precaution to run the new against the old before launching into a major series of experiments.
When switching master mix products, it is critical to recognize that some assays are particularly sensitive to buffer composition/annealing temperature (Ta)/primer concentration combinations. Changing any one of these may result in different performance. Therefore, verify all assays in selected master mixes and on all desired instruments before making radical changes. It is also essential to review the instructions provided with each master mix because they specify the recommended conditions that are optimized for the given enzyme, Hot Start mechanism and buffer components.
| Problem | JumpStart™ Taq ReadyMix™ doesn’t work as well as a similar product from a different supplier |
|---|---|
| Possible Causes |
|
| Diagnostic Test |
|
| Solution |
|
| Problem | PCR ReadyMix works for PCR but not for qPCR, but equivalent products from a different supplier work well |
|---|---|
| Possible Causes |
|
| Diagnostic Test |
|
| Solutions |
|
It is good laboratory practice to ensure that sufficient reaction master mix is prepared for all samples that are to be run together. Ensure that all components are carefully thawed and mixed well and that the experiment master mix is very well mixed before aliquoting to samples. This is particularly relevant to some of the 2× buffers such as KiCqStart® that are more viscous than normal PCR buffers.
Oligo Optimization
Oligos may cause problems if they are; an incorrect sequence or poorly designed, run at a sub-optimal concentration, sub-optimal Ta, or are inadequately labeled or quenched (for probes). An assay run under sub-optimal conditions for the oligo, or using a poor design may yield some data, however this may not reflect the genuine biology under consideration. On receipt of a lyophilized oligo it is critical to:
- Verify the sequence
- Ensure that all DNA is resuspended prior to use
- Confirm the solution is the concentration expected
Resuspend oligos by heating the oligo to 90 °C for 5 min and then mixing well. Repeated cycles of freeze thaw can also affect oligo performance and therefore all oligos at a stock concentration (usually 100 μM) should be aliquotted and stored at -20 °C, or -80 °C for the long term.
During the troubleshooting phase it is critical to verify that the correct sequence was ordered by returning to the target sequence and confirming that the oligo sequences are indeed present. Ensure that the oligo quality was correct by contacting the oligo vendor. Measure the working concentration of the oligo and visually inspect fluorescent molecules to confirm that these are labeled. Test the primers of probe assays in a SYBR® Green I qPCR mix to verify amplification. Consider optimizing primer concentrations or Ta (see Assay Optimization and Validation). When using a probe for the first time, collect fluorescent data for as many potential wavelengths as possible so that any potential leakage of signal between channels is observed and mistakes in labeling can be detected.
Inadequate PCR Optimization
The effect of assay optimization was described and demonstrated in Assay Optimization and Validation. When an assay fails or is performing sub-optimally, yet there are no mistakes in the design or operating procedures, it may benefit from optimization of experimental conditions. When troubleshooting, test the primers at 100 nM, 500 nM and 900 nM final concentration and/or Ta between 55 °C to 70 °C (using a temperature gradient) to identify whether the assay will improve with further optimization.
RT-PCR and qPCR Assay Design
Assay design was described in PCR/qPCR/dPCR Assay Design. When troubleshooting an assay, ensure that the design has been verified. Confirm that the PCR/qPCR primer and amplicon position is consistent with the RT priming protocol. For example, ensure that assays applied to cDNA that was prepared after oligo-dT priming are situated towards the 3’ of the transcript. Ensure that the sequence information is reliable and that appropriate splice variants and SNPs have been considered.
| Problem | The assay is insensitive and the amplification plots look abnormal (Figure 11.1) |
|---|---|
| Possible Causes |
|
| Diagnostic Test |
|
| Solutions |
|

Figure 11.1A.The assay has an unusual amplification plot profile with a pronounced drift of the baseline.

Figure 11.1B.The sequence for the probe that was included in the assay was entered into mfold folding prediction software. It is clear that the probe could adopt a stable folded structure in solution and this is likely to result in the observed problem.
RNA or DNA Template Quality
The effect of template quality on assay performance was described in Sample Purification and Quality Assessment. Template quality encompasses consideration of quantity, integrity and the presence of inhibitors. It is critical to ensure that RNA quality is matched to the most appropriate RT priming protocol (see Reverse Transcription) and to use the best quality template possible. Similarly, the quantity of RNA that is added to RT reactions must be within the scope of the protocol and, in many cases, this should be the same for all reactions. ReadyScript® is a notable exception to this guideline because adoption of this reagent and protocol yields a linear cDNA concentration that is proportional to the input RNA quantity. When troubleshooting a sample which is yielding a higher than expected Cq, run the SPUD assay or dilute the sample through a 1:5 or 1:10 dilution series and repeat the assay (Figure 11.2) to identify samples which contain inhibitors.
| Problem | The Cq data for dilutions of the standard curve are irregularly spaced (Figure 11.2) |
|---|---|
| Possible Causes |
|
| Diagnostic Test |
|
| Solutions |
|


Figure 11.2.Amplification of a 10-fold serial dilution of a DNA template. The replicates are precise but the ΔCq is inconsistent, decreasing with increasing dilutions. The data also shows a positive signal in the no template control (NTC) indicating contamination or primer dimer formation and that the dilutions to less than 105 copies have identical data to the NTC.
| Dilution | ΔCq |
|---|---|
| 107 → 106 | 5.4 |
| 106 → 105 | 5.0 |
| 105 → 104 | 3.6 |
Template quantity is also an important consideration. Including too much or too little template into the PCR will result in failed reactions and qPCR amplification plots that appear abnormal. Figure 11.3A shows a reaction containing a 10-fold serial dilution of artificial oligo template. The lower dilutions are too concentrated for the reaction to be efficient or for the instrument to effectively process the baseline data (Figure 11.3B), resulting in abnormal amplification plots and unreliable data.

Figure 11.3. A)Amplification of a 10-fold serial dilution of an artificial template with specific primers and a FAM-labeled probe. The Cq is very low for the concentrated samples, the amplification plots are not regularly spaced and are abnormal. B) Shows the raw data for these amplification plots. The reactions containing the highest concentration of target also have a significantly higher background fluorescence and minimal fluorescence yield through the reaction.
Assay PCR Program
The PCR cycling conditions must be suitable for both the experiment and the reagents (e.g., see Master Mix). Acceptance of default instrument settings without verification is inadvisable.
Thermal Cycler Malfunction
Instrument faults can have an insidious onset and can, therefore, be difficult to diagnose. To prevent expensive repair costs, ensure that all operators of instruments are fully trained and initially supervised. Some instrument faults cause catastrophic failures, resulting in no amplification or fluorescent data while others distort data or treat samples in a non-uniform manner creating artificial differences between identical biological samples. The use of control samples with control assays is invaluable for troubleshooting. When an instrument fault is suspected, a reliable, optimized assay should be run in all wells. This uniformity check will reveal problems that are specific to regions of the instrument as well as separate assay and instrument issues.
PCR Troubleshooting Examples Demonstrating the Use of the Diagnostic Tools
After running a well-planned PCR there are several diagnostic tools available for troubleshooting:
- Control samples and assays
- End-point gel/SYBR Green I dye reagent
- Amplification Plots (check replicates and amplification plot profile)
- Standard Curves (gradient and R2)/dilution series
- Melting/Dissociation Plots (SYBR Green I dye, Molecular Beacons, Scorpions® Probes)
- Raw data/multicomponent views
Control Samples/Reactions
The use of controls is strongly recommended. It is almost impossible to troubleshoot a failed assay without information from an appropriate suite of controls.
| Control | Example Material | Expected Result | Possible Reasons for a Positive Result | Possible Reasons for a Negative Result |
|---|---|---|---|---|
| Positive sample | A sample knwn to contain the assay sequences, e.g. RNA/gDNA expressing/ containing the tatget | Positive | Correct | Assay failure. Any positive data from other samples is unreliabe . |
| Positive assay control | Any nucleic acid compatible with the PCR assay design e.g..artificial oligo-nucleotide or plasmid con taining the PCR amplicon. | Positive | Correct | Assay failure. Any positive data from other samples is unreliable. |
| Negative control | A sample know not to contain the assay sequences, e.g.RNA/gDNA not expressing/not containing the target. | Negative | The assay is non-specifc or there was contamination of the control during PCR preparation | Correct |
| Contamination Negative assay control (No Template Control NTC) | Water | Negative | The primers are self dimerising resulting in primer dimer product or there was contamination of the control during PCR preparation. | Correct |
| RT-Specific Controls | Example Material | Expected Result | Possible Reasosn for a Positive Result | Posgble Reasons for a Negative Result |
|---|---|---|---|---|
| Minus RT enzyme negative control | RNA sample and all components of the RT rection with the exception of the RT enzyme. This should be performed on all samples to verity that they do not contain sequences that amplify under the PCR conditions without the need for RT, e.g. gDNA contamination | Negative | The sample contains gDNA. The reaction became contaminated durirg setup. The primers formed primer dimer products. Analyze in conjuction with NTC | Correct |
| Genotyping-specific | Example Material | Expected Result | Possible Reasons for a Positive Result | Possible Reasons for a Negative Result |
|---|---|---|---|---|
| Assay specific positive target. | Wild Type (WT) template detected with WT assay and mutant target detecled with mutant assay. | Positive | Correct |
|
| Assay specific negati\le target | WT template decected with mutant assay and mutant target detected with WT assay. | Negative (or relatively high Cg compared to positive control). |
| Correct |
| Assay heterozygote control | Heterozygote template or a 1:1 blend of each homozygote detected with WT assay and with mutant assay. | Positive with both assays. | Correct |
|
| Problem | The positive control amplifies but there are no amplification results from a sample known to contain target (Figure 11.4A) |
|---|---|
| Possible Causes |
|
| Diagnostic Test |
|
| Solutions |
|

Figure 11.4. A)Undiluted template fails to amplify whereas dilutions show improved amplification efficiency. B) Addition of 0.3% BSA to the qPCR mix supports amplification from the undiluted template.
Investigations into a completely failed assay can be difficult because there is little information to work with for troubleshooting. Since many assay failures are the result of some catastrophic error, the first check should be to verify the experiment set up and then repeat the PCR. If this fails, the troubleshooting process is dependent on information regarding each component of the experiment (Figure 11-5).
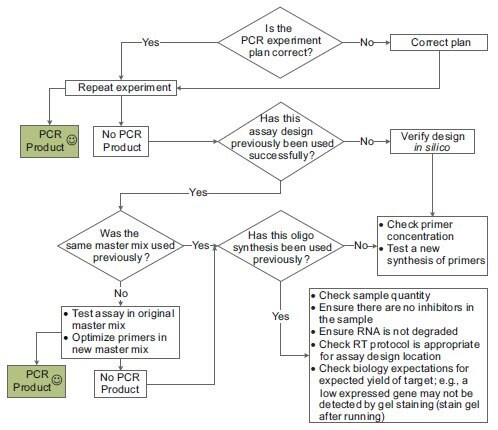
Figure 11.5.The basic troubleshooting process for PCR.
When a qPCR experiment completely fails, the first step is to check assay design, the oligo sequences and the QC data from the oligo manufacturer. Although the assay may have failed, qPCR multicomponent/raw data can be used to provide further information. Figure 11.6A shows the raw data plot for two assays containing either a 6-FAM™ or a HEX™ (VIC®) labeled probe. Although both assays show amplification, the HEX signal is approximately half of that of the FAM signal. Since this is an inherently weaker dye, this is a normal observation. The agarose gel analysis (Figure 11.6B) shows both reactions yield a similar concentration of products, supporting the observation that the qPCR Cq values are similar.
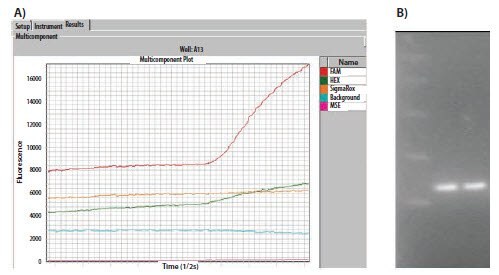
Figure 11.6. A)The raw data plots of a duplex assay containing a FAM and a HEXlabeled probe. The FAM probe naturally yields higher fluorescence. B) The agarose gel showing that equal quantities of product were produced in each reaction and confirms the qPCR Cq observation.
Examination of the raw data is a useful check to verify that the probe is labeled correctly and was added to the reaction. Figure 11.7 shows the raw data for the amplification of three targets in a triplex experiment. The probes specific to each target are labeled with FAM, HEX and TAMRA. The HEX and TAMRA probes show a low background and efficient amplification, however the FAM signal is consistently high throughout the experiment and there is no evidence of amplification. This is consistent with too high probe concentration in the reaction or a fault with the probe such that there is no initial quenching of the signal. In such cases the probe concentration and assay design should be verified, ensuring that the probe has a compatible label and quencher and, if required, a new probe tested.

Figure 11.7.A triplex reaction was used to detect three targets using probes labeled with FAM, HEX and TAMRA. The HEX and TAMRA probes yielded amplification from the targets but the FAM probe showed no amplification. Examination of the raw data revealed that the background fluorescence was exceptionally high and no difference was observed throughout the reaction. This is consistent with too high a probe concentration in the reaction or a faulty probe with inadequate quenching.
If the original experiment relied upon probe detection the assay should be repeated using SYBR Green I reagents, including a positive and negative control (but not precious samples). Alternatively the products of a failed reaction can be checked on an ethidium bromide stained agarose gel. Adopting the SYBR Green I approach for repeating the experiment is preferable because it avoids the risk of contamination and provides a repeat experiment to verify the initial failure. If the SYBR Green I experiment provides data, it is possible that the original probe failure was due to either a technical error or probe fault. To differentiate between experimental error or a fault with the probe, repeat the probe experiment; if the reaction fails again, replace the probe. This approach can be adopted to investigate reactions that are producing poor data. In the example shown in Figure 11.8, the probe reaction was sub-optimal and when compared to the reaction run using SYBR Green I, it can be seen that the probe signal does not reflect the experiment. In such cases the assay design should be verified and a new probe tested.

Figure 11.8.Identical reactions were run containing either a qPCR probe or SYBR Green I dye (as indicated). The SYBR Green I reaction was approximately eleven cycles more sensitive and yielded much higher end-point fluorescence. This is indicative of a fault in the probe or problem with the probe design (data kindly provided by Prof. Stephen Bustin, UK).
Validating probe labeling
The raw data or multicomponent plot is a useful diagnostic tool to investigate whether the appropriate concentration of probe has been included into the reaction and that the probe is adequately labeled and quenched. Figure 11.9 shows the multicomponent plot for a reaction containing three probes. The first two generate amplification plots and background fluorescence is evident. There is no data from the third probe and an examination of the raw data reveals that the background fluorescence is equivalent to the water blank control which does not contain any probe. Therefore, this data is the result of absence of fluorescence in the reaction. This would be due to an error during set up in which the probe was not included or that the probe was not labeled.
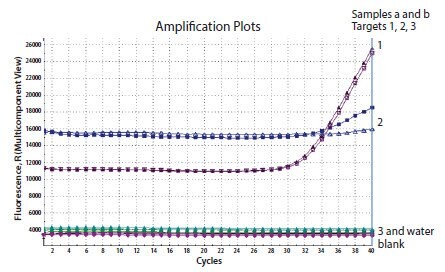
Figure 11.9.Three genes were detected in the same template sample. Two reactions resulted in amplification (1 and 2), however the 3rd was negative. An examination of the multicomponent view reveals that the background fluorescence for the 3rd reaction is equivalent to the water control indicating an absence of signal.
A further check of the probe labeling can be performed using a DNase I digestion. This must be performed with extreme care to ensure that probe and primer stocks are not contaminated with enzyme, which would lead to catastrophic results. An aliquot of a failing probe (Figure 11.10A) equivalent to that included in a reaction, e.g., 300 nM is incubated with and without DNase I. This can be carried out in real time (Figure 11.10B) such that the fluorescent yield is measured with respect to time or alternatively, the initial and end point (after 10 min) reading provide sufficient information. When performing this test it is important to compare the data to a probe that is functioning well and has the same fluorescent label and quencher (Figure 11.10B).

Figure 11.10. A)Two templates were detected using different probes, both FAM labeled. While detection using one probe resulted in a high fluorescent signal, the second was much weaker. B) A control and a test probe (300 nM) were incubated at 37 °C in a real time instrument in DNase I buffer in the presence or absence of DNase I enzyme. The fluorescent release from probe 1 was approximately twice that from probe 2, demonstrating that probe 2 labeling was inadequate.
| Problem | Low or absent fluorescence in both the test sample and in the positive control. The correct PCR product is visible on the gel and the design is verified | ||
|---|---|---|---|
| SYBR Green Dye-Based Detection | Probe Detection | ||
| Possible Cause | Bad SYBR Green I binding dye. |
|
|
| Diagnostic Test |
|
|
|
| Solutions | Purchase new SYBR Green I binding dye or a new qPCR mix with SYBR Green binding dye. |
| Purchase a new probe. |
Amplification Plots
The structure of the amplification plots and the reproducibility of technical replicates provide a wealth of information regarding the quality of the qPCR assay and may also provide the first warning indications that all is not as it should be. The amplification plots in Figure 11.11A are non-typical, very noisy and would be difficult to interpret accurately. A further examination of the dR fluorescence values reveals that the end-point fluorescent yield is only 400 units, indicating that the reaction is inadequate but the amplification plots have been generated by the instrument software and autoscaled. Similarly, the data in Figure 11.11B have a pronounced foxtail (decreasing curve) at the beginning of the profile, before increasing again after a baseline section. The appearance of the foxtail is consistent across two reactions, but one reaction has a much lower end-point (Figure 11.11C) resulting in an amplified, relative foxtail.
Figure 11.11. A) Amplification plots that are noisy due to autoscaling by the instrument software of poor data with low fluorescence. B) Reactions yielding low end point dR have a pronounced initial foxtail. C) The foxtail is seen as a normal effect when in proportion to the high quality assay.
Similarly, the amplification plots in Figure 11.12A are clearly abnormal and could not be used as they are presented. An amplification plot which dips below zero dR (Figure 11.12A) is a classic indication of inappropriate baseline settings having been applied. Examination of the raw data for this reaction (Figure 11.12B) shows that the actual amplification plots have a normal profile, confirming that the analyzed data are the result of an instrument software issue. The appropriate baseline can be deduced from the raw data and applied in the software. In this case cycles 6 to 16 represent the initial linear, baseline phase of the reaction and when applied, result in normal amplification plots (Figure 11.12C).

Figure 11.12. A)Amplification plots were clearly abnormal with a section of the profile dipping below the baseline. B) Examination of the raw data plot reveals that the reaction data are as expected. C) Setting the instrument baseline according to the appropriate cycles restores the normal profile to the data of analyzed amplification plots.
The amplification plot profile can also be interpreted to give information about the quality of the assay and optimization. Figure 11.13 shows the attempted amplification of a 10‑fold serial dilution of template with each concentration run in duplicate qPCR. The reproducibility between replicates is poor, the cycle difference (ΔCq) between the data is not constant and it is not 3.323 cycles, as expected for a 10-fold serial dilution. Examination of the amplification plots, with consideration to this being a standard curve, reveals that the assay is below standard and could not be used for analysis. The reasons would need further investigation but could be the result of; poor assay design (see PCR/qPCR/dPCR Assay Design), sub-optimal assay conditions (see Assay Optimization and Validation), or poor pipetting (repeat assay).

Figure 11.13.A cDNA sample was diluted through a 10-fold serial dilution and the specific template detected using duplicate qPCR for each dilution. The replicates are poor, indicating a problem with pipetting or with assay optimization.
| Problem | The fluorescence plots suddenly spike upwards (Figure 11.14). |
|---|---|
| Possible Causes | Bad reference dye or instrument error (e.g., door was opened during run). |
| Diagnostic Test |
|
| Solutions |
|

Figure 11.14.During a standard qPCR the data suddenly spike upward with a non-typical profile.
| Problem | Declining or hooked fluorescence plots (Figure 11.15) |
|---|---|
| Possible Causes | As PCR product accumulates, the complimentary strand competes with the primer and/or probe for annealing to template. |
| Diagnostic Test | See Figure 11.15. |
| Solutions | Disregard it if the Cq is not affected. |

Figure 11.15.For declining or hooked fluorescence plots, the possible cause may be due to the complementary strand competing with the primer and/or probe for annealing to template. Ignore as long as Ct is not affected
Dissociation / Melt Curves
The dissociation or melt curve analysis is run after the qPCR and is an analysis tool that is used in conjunction with DNA-binding dyes (such as SYBR Green I) or non-degrading probes such as Molecular Beacons or Scorpions® Probes, to verify that a single product has been amplified. After PCR amplification, the resulting amplicon is incubated at increasing temperatures and the changes in fluorescent signal are detected as the DNA transitions between double-stranded and single-stranded states. When the reaction contains a single amplicon, this melts uniformly and the plot of dF/dT (rate of change of fluorescence with respect to temperature) shows a single peak. Examination of the melt curve is particularly effective when combined with data from controls. Figure 11.16A shows the post qPCR melt profile for a series of experimental test samples, the positive control and the no template control. The melt profile for the test samples is identical to the positive control and each of these show a single peak for the dF/dT. The melt profile for the no template control has a broader profile and a lower Tm. These observations are both consistent with the presence of primer dimers being apparent in the negative control. This is confirmed using an ethidium bromide stained agarose gel (Figure 11.16B) which also shows that the primer dimers become apparent when the template is present at low concentration. This causes an over estimate of the target when detected in samples of low target concentration. Therefore, the assay should be optimized or re-designed. In contrast, Figure 11.16C shows that the melt profile for the product in the no template control is identical to the melt profile for the positive control and test sample. This is a clear indication of contamination of the no template control with template during the experiment set up. The final example demonstrates the recognition of amplification of target from gDNA that is present in a cDNA sample (Figure 11.16D). The amplicon derived from gDNA is longer and, therefore, has a
higher Tm than that from cDNA.

Figure 11.16A.A positive control, test reaction and NTC were amplified and then subjected to post-PCR melt analysis. There is product evident in the NTC that melts at a lower temperature and with a broader melt peak, consistent with primer dimer formation.

Figure 11.16B.Primer dimers are evident on a gel resolution of these samples (along with others), with primer dimer formation being inversely proportional to input template concentration.

Figure 11.16C.An example of applying melt curve analysis to identify reaction contamination in the NTC.
Figure 11.16D.Identifying a larger amplicon that has resulted from PCR of gDNA.
| Problem | Multiple Tm peaks in melt profile data | |
|---|---|---|
| Single Product on a Gel (Figure 11.17) | Multiple Products on a Gel | |
| Possible Causes | Localized AT or GC-rich regions or short repeats in PCR product causing imperfect reannealing of amplicon with apparently different melt profiles. | The primers are non- specific and are producing multiple products.
|
| Diagnostic Test | Check sequence of amplicon for AT or GC-rich regions or repeats. | BLAST primer sequences against the sequence of the source organism to verify single target. |
| Solutions | This is not a problem if the gel analysis shows that all product is specific. Continue to use the primers. |
|

Figure 11.17. A)A melt profile and B) agarose gel analysis of a SYBR green I reaction. Although the melt profile suggests products of varying Tm, the gel image indicates that a single amplicon is present. This is indicative of an amplicon sequence that contains AT or GC rich regions or a repetitive element resulting in irregular melting
Serial Dilution of Template/Standard Curves
Regardless of whether the experimental design includes the requirement for a standard curve for eventual quantification, detecting a serial dilution of suitable template is a powerful approach to assay validation and troubleshooting. Detection of a serial dilution allows the experimental linear dynamic range of the assay to be defined. Figure 11.18A shows a standard curve with low concentration data points that do not fit the linear profile. The most usual reason for this pattern of data is that primer dimers have been formed in samples of low concentration (as shown in Figure 11.18B). This is the standard curve generated from the data shown in Figure 11.2. Figure 11.18C shows a standard curve with highly concentrated samples falling out of the linear range. The most usual reasons for this are template inhibition of the reaction or that the baseline settings are inappropriate.
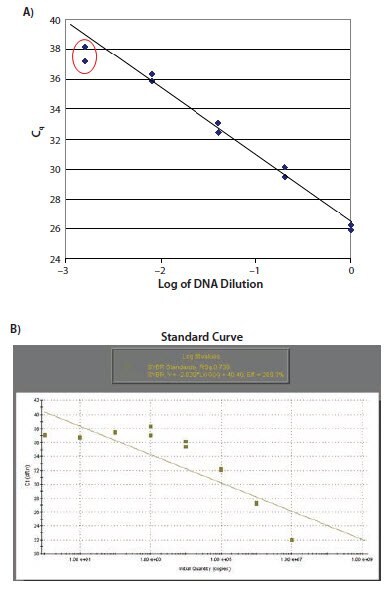
Figure 11.18. A) The data points relating to the lower concentrations of target do not lie on the standard curve. B) This is typical of a reaction resulting in primers dimers as illustrated. In this case there is no observed increase in Cq for the samples at low concentration.

Figure 11.18C.The samples with high concentrations of template do not lie on the standard curve. This is typical of reactions that are inhibited by template concentration or due to incorrect baseline setting.
The standard curve is also used to measure the efficiency of the reaction across the dynamic range of dilutions. Care must be taken to ensure that all points used for efficiency calculations lie on the line. Reactions should be as close to 100% efficient as possible and those with apparently high (>110%) or low (<85%) efficiency investigated further.

Figure 11.19A.A template nucleic acid was diluted through a 10-fold series. The amplification plots have an abnormally shallow gradient and the ΔCq is 4 cycles rather than the expected 3.3.

Figure 11.19B.The gradient of a standard curve plot of Cq against quantity is used to calculate the efficiency of the reaction.
| Problem | PCR efficiency is greater than 120% (Figure 11.20) |
|---|---|
| Possible Causes |
|
| Diagnostic Test |
|
| Solutions |
|
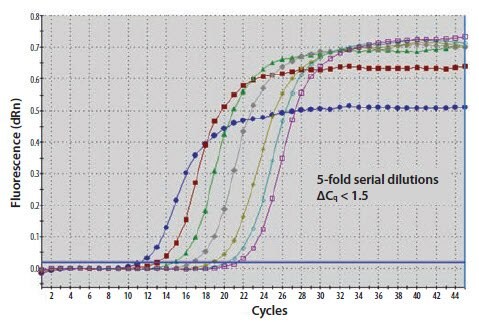
Figure 11.20A.A template nucleic acid was diluted through a 10-fold series. The ΔCq between amplification plots is 1.5 cycles rather than 3.3

Figure 11.20B.The gradient of a standard curve plot of Cq against quantity is used to calculate the efficiency of the reaction which is close to 140%.

Figure 11.20C.An examination of the melt curve profile reveals that the samples of lower concentration (yellow and blue traces) also contain signal from amplified primer dimers (peak at lower Tm).
Troubleshooting RT-PCR Case Studies
A failing probe assay
A probe-based assay was designed to detect EIFB1 in human cDNA samples but shows no amplification. The initial reactions were run on an ABi StepOne instrument using compatible reagents. An attempt was made to optimize primers using a range of concentrations from 200 nM to 900 nM (Figure 11.21) but with no improvement. The assay design was verified and found to be appropriate to the target and, in silico, it was predicted that this was a high quality assay. New primers were synthesized and run alongside an aliquot of the original synthesis using a different operator, SYBR Green I reagents (therefore different reagents) and instrument (an Eppendorf Realplex) (Figure 11.22). While adopting this approach we were mindful that the primary objective was to solve the problem, while the secondary objective was to explain the failure. This reaction yielded equivalent amplification from both batches of primers. At this stage it appeared that the reaction problem lay with the probe and therefore a new probe was synthesized and both batches were compared by the second operator on the Realplex instrument using LuminoCt® reagents (different reagents to those originally tried) (Figure 11.23). Both probes yielded amplification data, the new probe appearing slightly better than the original although it is noteworthy that the original probe had been posted between test labs and therefore was at room temperature, in solution for several days. At this stage it was clear that both the original and replacement assays functioned when run by the second operator in LuminoCt® reagents on the Realplex instrument.
Therefore, the remaining reasons for the original failure were considered to be:
- Operator: the experiment was repeated several times by an experienced scientist and, therefore, this was considered an unlikely explanation.
- Instrument: could have some issues since some other assays were failing.
- Reagents: easiest explanation to test. The LuminoCt® reagents were compared to the existing reagents using both oligo batches on the ABi StepOne instrument, by the first operator. The reaction failed with the original reagents but gave good amplification with LuminoCt® reagents (Figure 11.24).

Figure 11.21.Primers to EIFB1 were tested at concentrations between 200 nM and 900 nM. No amplification was observed under any condition (oligos and ABi reagents on ABi StepOne Plus).

Figure 11.22.Two batches of primers to EIFB1 were compared in SYBR Green I reagent; the original failing batch and a new batch. (oligos and reagents on Eppendorf Realplex instrument). Both sets of primers supported amplification.

Figure 11.23.Two batches of primers and probes to EIFB1 were compared in LuminoCt® reagent; the original failing batch and a new batch. (oligos and reagents on Eppendorf Realplex instrument). Both sets of oligos supported amplification.
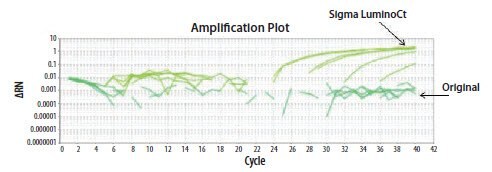
Figure 11.24.The EIFB1 primer and probe assay was run in two different reagents (Original ABi or LuminoCt® reagent). Data was only acquired from this assay when run using LuminoCt® reagents.
The reaction efficiency was incorrect and variable
A test was carried out on a serial dilution of an artificial oligo, using a standard primer and probe assay. The assay had originally been developed and optimized on a different instrument, but the strange dilution effect was not expected when transferred to a different test lab and instrument (Figure 11.25A). All assay conditions were re-optimized to be specific to the new lab but with no change to the data. The operator observed that the effect was more pronounced when the assay was repeated within a few hours, using the same dilution series. As part of the troubleshooting process, the assay was run on a different instrument by a different operator who again, generated the expected standard curve. This lead to the suggestion that the initial problem was due to; operator error, instrument failure, or some subtle variation in experimental procedure. Since both operators are highly experienced and the instrument was functioning well for other experiments, the subtle differences option was examined. An important clue was the observation of the variability in data from the same dilution series after a period of storage of the samples at 4 °C (Figures 11.25A and 11.25B). This lead to an examination of the tubes used for the dilution series and a test of alternatives. After switching to Eppendorf 1.5 mL reaction tubes for the dilution series, the predicted standard curve was generated (Figure 11.25C), demonstrating that it is essential that molecular biology, low retention plasticware is selected for PCR and that these assays are sensitive to subtle variations in protocol.

Figure 11.25A.An artificial oligo template was diluted 10-fold and detected using a specific probe-based assay. There are inconsistent differences between the amplification plots.

Figure 11.25B.An artificial oligo template was diluted 10-fold (these are the dilutions that are detected in Figure 11.25A) and left at 4 °C for several hours before being detected using a specific probe-based assay. There are inconsistent differences between the amplification plots which are exacerbated by the time between dilution and testing.

Figure 11.25C.An artificial oligo template was diluted 10-fold into molecular biology-grade tubes and detected using a specific probe-based assay. There are consistent differences between the amplification plots, as expected.
Summary — PCR Troubleshooting Checklist
- Check quality of sample (degraded material will cause erroneous results).
- Check RT protocol is compatible with design (e.g., an Oligo-dT primed RT must have a qPCR assay in the 3’ 1 kb of sequence).
- Check assay design.
- Check all controls.
- Check primers using SYBR green I dye/run a gel.
- Ensure correct software settings (baseline, dye detection, concentrations for standards).
- Ensure ROX concentration is applicable for instrument (and not interfering with multiplex).
- Check background fluorescence levels.
- Check probe labeling with DNase I assay or repeat probe synthesis.
Per continuare a leggere, autenticati o crea un account.
Non hai un Account?