Cryopreserved PBMCs Retain Phenotype and Function
Frozen (cryopreserved) peripheral blood mononuclear cells (PBMCs) offer many advantages over fresh PBMCs, enabling researchers to plan their experiments ahead of time with ready-to-use cells that can be stored in the freezer until needed. One concern with frozen cells is the potential loss of viability, phenotype, or function resulting from cryopreservation. We report here the characterization of frozen PBMCs from BioIVT as well as direct comparison of T cell activation responses through measurement of expression levels of well-established T cell activation markers (CD25 and CD69). Data suggest these frozen PBMCs maintained viability and phenotype during cryopreservation. While stunted, T cells exhibited appropriate activation responses upon anti-CD3 and anti-CD28 antibody stimulation. Functional, viable cryopreserved PBMCs offer a convenient alternative to fresh PBMCs in cell-based assays and immunological studies.
Frozen PBMC characterization
Frozen PBMCs were first assessed for viability using propidium iodide staining and characterized by flow cytometry using fluorescent antibodies against the following protein markers:
- CD14 (monocyte marker)
- CD56 (NK cell marker)
- CD4 (T helper subset)
- CD8 (T cell subset)
- CD19 (B cells)
Cryopreserved PBMCs from three individual healthy donors were used for all experiments. Representative data are shown in Figure 1. Viability and composition results are summarized in Table 1. Average cell viability was determined to be 91.8% (Figure 1.A.). The phenotypic composition of each cell population, expressed as a percentage of the gated cell population (see Figure 1.B.), aligned with expected values. Results suggest these frozen PBMCs maintained viability and phenotype during cryopreservation and thawing.
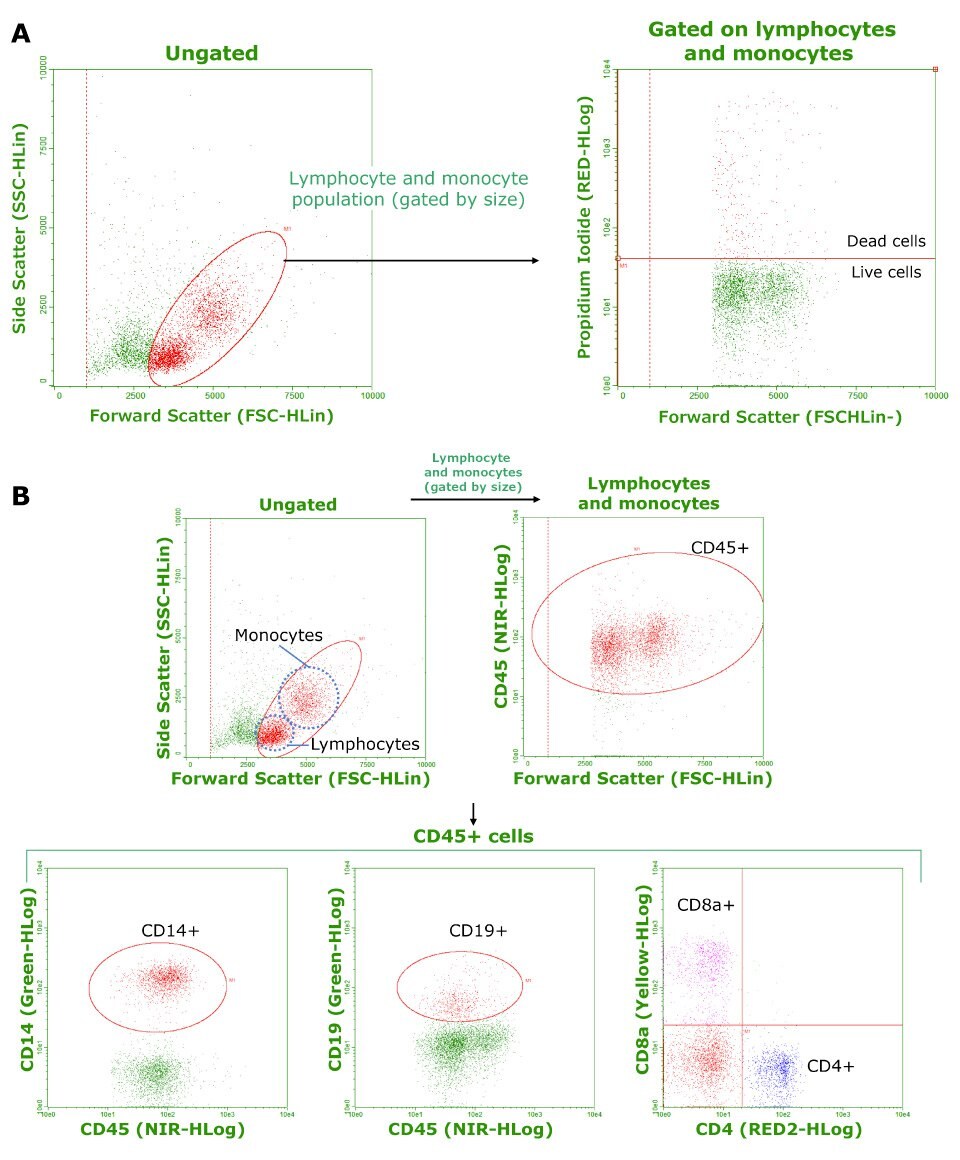
Figure 1.A) Frozen PBMC viability as determined by propidium iodide staining and flow cytometry. Calculated cell viability (averaged from three samples) was 91.8%. B) Phenotypic analysis of frozen PBMCs. CD45+ cells were analyzed for CD14, CD19, and CD8/CD4 expression to determine the composition of monocytes, B cells, and T cells respectively. For NK cells, CD56 staining was used. Tabulated results are shown in Table 1.
PBMCs and T cell activation
Peripheral blood mononuclear cells consist of lymphocytes (T cells, B cells, NK cells) and monocytes. These cells give selective responses to the immune system and are key players in immunity. T cells are activated through extracellular signals that are mediated mainly by T cell receptor (TCR) complexes. It has been shown that certain agonists such as antibodies to CD3 and CD28 can trigger TCR signaling observable through changes in cell surface marker expression similar to actual activation of TCR via antigenic stimulation. Activation of T cells results in increased CD25 expression and transiently increased CD69 expression (Figure 2). CD25 and CD69 cell surface markers can therefore be used as measures of T cell activation and function.
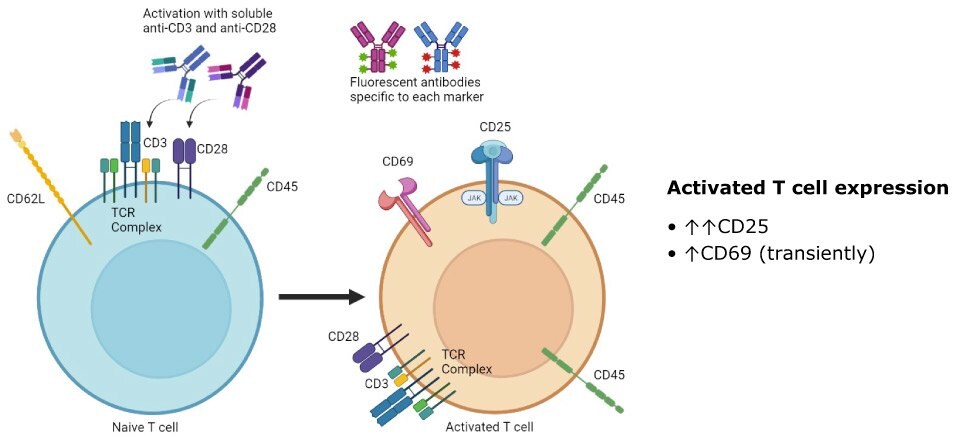
Figure 2.Activated T cells display increased CD25 expression and transiently increased CD69 expression.
To determine whether these frozen PBMCs retained their function, we used flow cytometry to measure changes in CD25 and CD69 following stimulation with anti-CD3 and anti-CD28 antibodies. Experiments were performed using both fresh and frozen PBMCs.
CD25 Expression
PBMC samples were processed in three separate experiments. For each experiment, cell surface marker expression was compared using two samples of fresh cells from different donors and two samples of frozen cells from different donors. Cells were activated using RPMI(+) culture media containing anti-CD3 (3 µg/ml) and anti-CD28 (1 µg/ml) antibodies. RPMI(+) media without activation antibodies was used as a baseline control. Cells were stained using fluorescently labeled anti-CD25 antibody at the indicated time points post-activation and analyzed the same day by flow cytometry (Figure 3). For analysis, cells were gated by size for the lymphocyte population using forward scatter area and side scatter area. Cells were then selected by gating on lymphocytes using CD45+ expression and gating on T cells using a combined gate of CD4+ and/or CD8+. The resulting cells were considered T cells of either CD4+ or CD8+ lineage.
As expected, both fresh and frozen PBMCs showed an increase in T cell CD25 expression following activation with anti-CD3 and anti-CD28 antibodies. Fresh cells exhibited a larger initial increase in CD25 expression compared to frozen cells post-activation, though a robust response was still observed with frozen cells on Days 1 and 3. Longer incubations resulted in a larger increase in CD25 expression for both fresh and frozen cells.
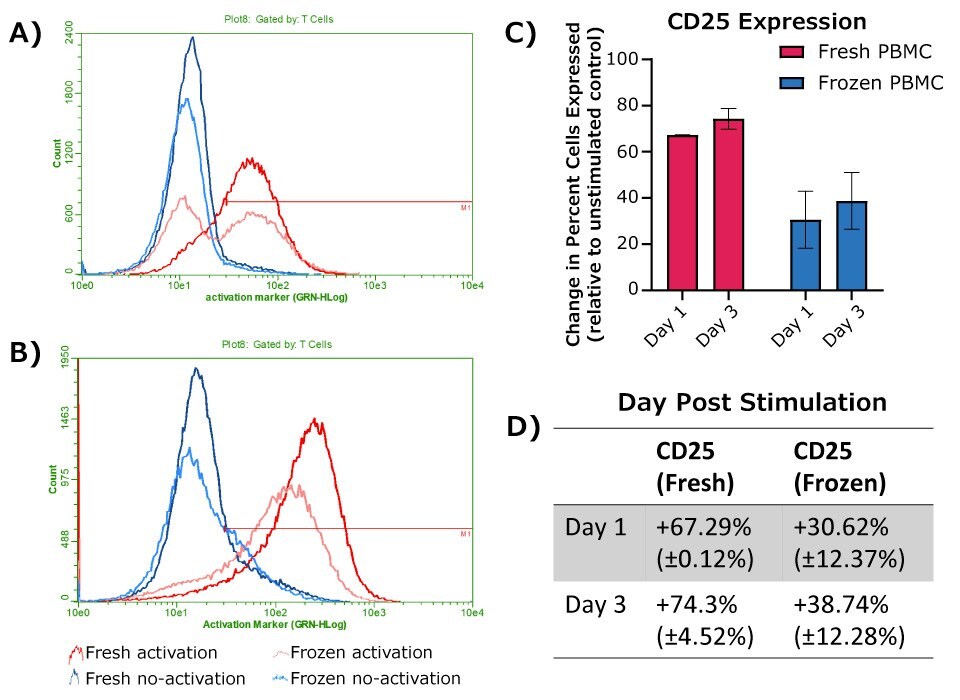
Figure 3.Expression of CD25 at 24 hours (A) or 72 hours (B) post-activation, with donor matched no-activation control samples for each timepoint. A-B) Representative histograms, with cells shown gated on CD45+ WBCs and either CD4+ or CD8+ for T cells. C) Change in percent of cell population expressing CD25, calculated as the difference between donor match activation and no-activation samples (fresh PBMCs, n = 2; frozen PBMCs, n = 4). D) Table depicting the values graphed in C.
CD69 Expression
Experiments and gating strategy were run as described for CD25, using fluorescently labeled anti-CD69 antibody instead of fluorescent anti-CD25 antibody. Results are shown in Figure 4. As expected, both fresh and frozen PBMCs showed an increase in T cell CD69 expression following activation with anti-CD3 and anti-CD28 antibodies. Fresh cells again exhibited a larger initial increase in CD69 expression compared to frozen cells post-activation, though a detectable response was still observed with frozen PBMCs. For CD69, a significantly larger response was observed one day post-activation compared to three days post activation for both fresh and frozen cells. This aligns with the expected transient response of the CD69 cell surface marker.
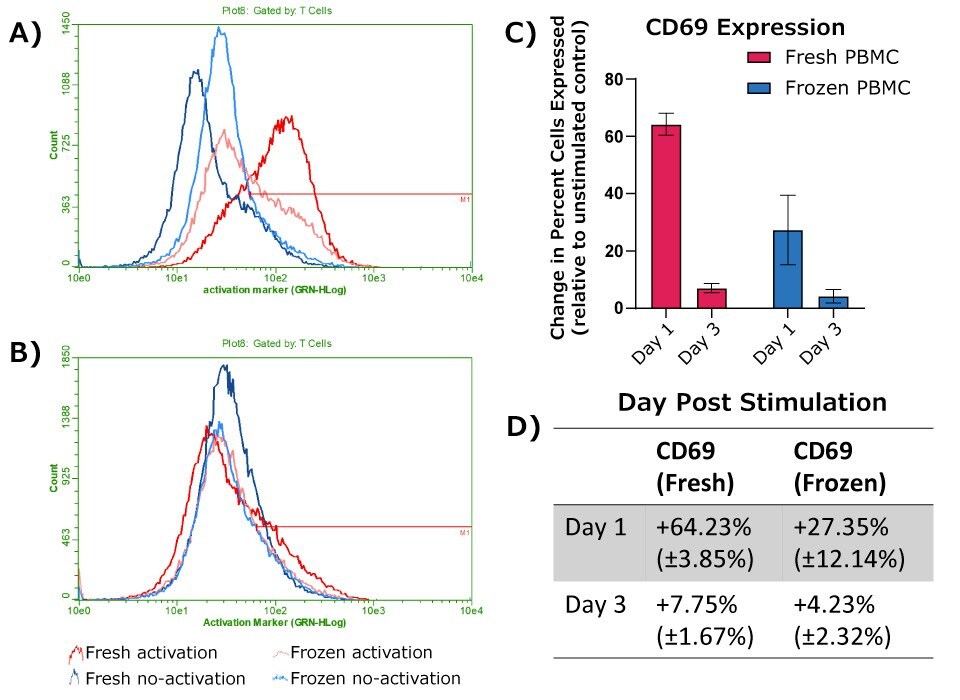
Figure 4.Expression of CD69 at 24 hours (A) or 72 hours (B) post-activation, with donor matched no-activation control samples for each timepoint. A-B) Representative histograms, with cells shown gated on CD45+ WBCs and either CD4+ or CD8+ for T cells. C) Change in percent of cell population expressing CD69, calculated as the difference between donor match activation and no-activation samples (fresh PBMCs, n = 2; frozen PBMCs, n = 4). D) Table depicting the values graphed in C.
Frozen PBMC Function Summary
Functional results are summarized in Figure 5. Patterns of changes in CD25 and CD69 marker expression matched expected responses for both fresh and frozen PBMC samples. Frozen PBMCs showed weaker initial activation compared to fresh PBMCs as measured by changes in CD25 and CD69 marker expression. Despite this difference, detectable responses were observed with frozen cells at both 24 hours and 72 hours post-activation. These data suggest these frozen PBMCs retain viability, phenotype, and function after cryopreservation, offering a convenient, ready-to-use alternative to fresh cells for most applications.
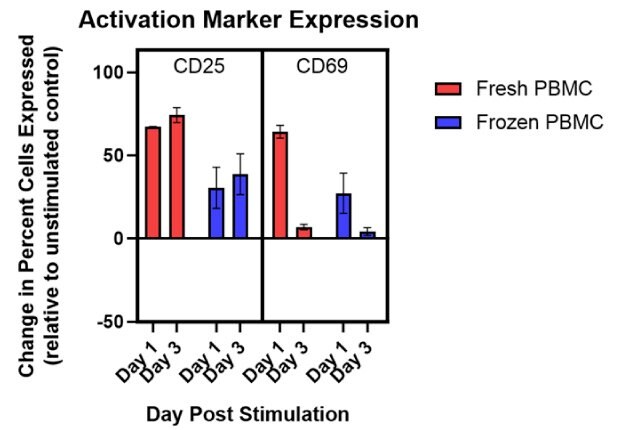
Figure 5.Summary of data comparing activation of fresh and frozen PBMCs as measured by changes in CD25 and CD69 marker expression. Though a weaker response was observed with frozen cells, the data suggest these cryopreserved PBMCs retain their function.
Materials
Cell Thawing and Treatment
- Thaw frozen vials of PBMCs in the 37 °C water bath for 2-5 minutes.
- Add RPMI(+) medium to both frozen and fresh PBMCs.
- Pellet cells at 300 x g for 5 minutes.
- Remove supernatant.
- Resuspend cells in RPMI(+) medium.
- Count cells on hemocytometer and plate 100,000 live cells in a 200 µl volume per well into a 96-well plate. Note that samples will be resuspended in RPMI(+) media containing anti-CD3 (3 µg/ml final concentration) and anti-CD28 (1 µg/ml final concentration) for stimulation and activation response, or only RPMI(+) media alone for non-activated samples.
Cell Staining and Gating on Flow Cytometer
- For all wash steps, use FACS buffer.
- Begin with samples in a 96-well plate as described in the “Cell thawing and treatment” section. Transfer the whole volume of each well (~200 µl) into individual microcentrifuge tubes.
- Add 1 ml FACS buffer to each microcentrifuge tube.
- Spin down the microcentrifuge tubes in a centrifuge at 300 x g for 5 minutes. Make sure cells formulate a pellet. If no visible pellet, repeat spin of cells.
- Remove supernatant to 50 µl line on microcentrifuge tube. Resuspend cells with light pipetting.
- Add in the fluorophore-labeled antibody against the desired cell surface marker and incubate in the dark for 40 minutes at room temperature.
- Repeat steps 3-5.
- Resuspend cells in 250 µl of FACS buffer and mix by gently pipetting. Stain cells for viability if desired.
- Transfer the full volume (~300 µl) from each microcentrifuge tube into a 96-well U bottom plate for analysis using a Guava® easyCyte™ 8HT Flow Cytometer.
View our full listing of normal PBMCs, disease state PBMCs, and immune cell subsets from BioIVT.
Um weiterzulesen, melden Sie sich bitte an oder erstellen ein Konto.
Sie haben kein Konto?