Analytical Size-exclusion Chromatography Columns for Biomolecule Separations
Cory E. Muraco, Hillel Brandes, Stacy Shollenberger
Reporter US Volume 34.3
What is size-exclusion chromatography?
Size-exclusion chromatography (SEC) is a mode of chromatography that separates molecules according to their hydrodynamic radius. The stationary phase consists of spherical, porous particles with a carefully controlled pore size through which molecules diffuse, based on their size difference, using an aqueous buffer as the mobile phase. SEC is an entropically-controlled separation process in which the analytes are “filtered” rather than retained on the column through chemical interactions between the stationary phase and specific, functional groups on the analyte.
It is crucial that residual silanol interactions, from silica-based stationary phases, are minimized as this interaction results in tailing analyte peaks. This problem is magnified when dealing with larger biomacromolecules.1,2 In SEC, retention factors (k) can be calculated by examining the volumes required to elute the analyte (Ve) and the interstitial volume (Vi). The interstitial volume is the volume of an analyte that fully permeates through the pores of the particle. Therefore, k can be calculated via Equation 1.3
k = (Ve-Vi) / Vi
(1)
Estimating molecular weight using size-exclusion chromatography columns
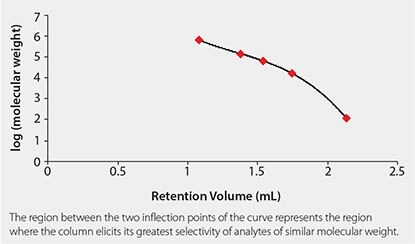
SEC can also be used to estimate the molecular weight of an unknown analyte by creating a calibration curve using known molecular weight standards. By plotting the log M (log molecular weight) versus Ve, a third order polynomial is generated. The linear region within this polynomial provides the highest resolution and mass accuracy for the given column. The slope of the line in the linear portion of the calibration curve is a measure of the selectivity of the stationary phase. Substituting the previously mentioned terms into the general equation for a linear line, one obtains Equation 2.4
log M= m * KD+b
(2)
where KD is the distribution constant for a particular analyte
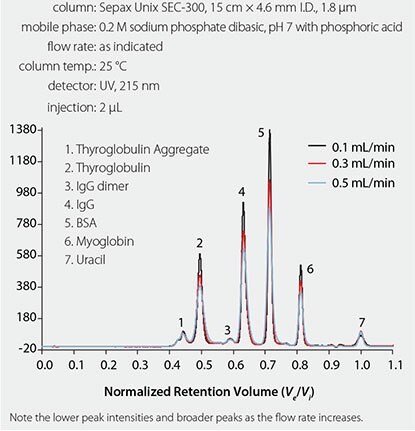
As the pore size distribution of the particle becomes narrower, the slope becomes shallower, resulting in greater selectivity of analytes of similar molecular weight. An example of a typical SEC calibration curve, using a new sub-2 μM SEC column from Sepax, is given in Figure 1.5 There has been a major trend in the chromatography field to develop methods that are optimized for high throughput. High throughput is especially important in the pharmaceutical industry, where hundreds of samples are analyzed daily in quality control (QC) laboratories. Longer run times cost the prospective company money in terms of mobile phase consumption, instrument time, and energy usage. Generally, there are three ways to decrease the run time in a chromatographic method: increase the flow rate, increase the column temperature, or reduce the column length. For SEC of biomolecules, increasing the flow rate will result in peak broadening along with the concomitant increase in back pressure, which is illustrated in the overlaid chromatograms in Figure 2.

Figure 1.SEC calibration curve using a Sepax Unix SEC-300 Column

Figure 2.Overlaid chromatograms showing the effect of flow rate on chromatographic efficiency
Speed and efficiency of size-exclusion chromatography columns
Another way to decrease the method run time is to increase the column temperature. For biomolecules, the main challenge in obtaining high-speed and high-resolution separations in SEC is the slow mass transfer of the analytes between the interstitial space of the column and the pore space of the stationary phase. By increasing the temperature, the mobile phase viscosity decreases and the kinetics of the analytes increase, thus increasing the mass transfer rate of the analytes.6 However, elevated temperatures can cause aggregation and fragmentation of proteins, especially proteins with flexible regions in their tertiary structure.
Recently, advances in column technology have enabled the production of columns packed with smaller particles of 2 μM, or less, in diameter. Chromatographic theory portends that smaller particle size leads to narrower peaks due to better column efficiency. The limiting factor with using small particle size columns is the increase in back pressure that accompanies these columns. In addition, one study has suggested that, because of the high pressures generated by these columns, frictional heating my cause on-column aggregation or denaturation of temperature sensitive proteins, though this has not been widely reported in the literature.7
Sepax and Tosoh Biosciences, taking advantage of the high efficiencies of columns packed with smaller particles, have created two new column lines: Unix™ SEC-300 and TSKgel® UP-SW3000 respectively. The Unix column is a fully porous, 1.8 μM SEC column with 300 Å pores. Due to the large pore size and small particle size, the Unix column is optimized to perform fast and efficient separations of proteins and other large biomolecules. Figures 3 and 4 illustrate the advantages of using columns packed with sub-2 μM particles.
As was seen in the discussion and examples given above, using columns packed with sub-2 μM particles provides significant gains in efficiency over SEC columns packed with larger particles. Because of this “small particle advantage,” shorter columns can be employed for analytical applications, thus leading to cost savings for the end user without fear of compromising the results of the chromatographic analysis.

Figure 3. Speed advantage of using columns packed with sub-2 μM particles

Figure 4.Efficiency advantage of using columns packed with sub-2 μM particles
References
Pour continuer à lire, veuillez vous connecter à votre compte ou en créer un.
Vous n'avez pas de compte ?