Analysis of 17 Cannabinoids in Hemp and Cannabis
Workflow for Cannabinoid Analysis in Hemp and Cannabis
Introduction: Analysis of Cannabinoids in Cannabis and Hemp for Potency
Many countries throughout the world have started to legalize recreational and medicinal cannabis. In the United States, testing cannabis and cannabis products for potency is required. Emerging interest in the therapeutic benefits of minor cannabinoids has increased the demand for analytical methods capable of separating 17 cannabinoids. The cannabinoids targeted for testing consisted of those listed by the AOAC in standard method performance requirements (SMPRs) for dried plant material (low and high THC varieties), chocolates, and concentrates plus three additional cannabinoids of interest.
A complete HPLC workflow has been developed to simplify cannabinoid profiling and potency determination. This workflow offers the following:
• Step-by-step instructions for sample preparation and analysis of 17 cannabinoids
• Rapid high-resolution gradient method: 6 minutes on C18 column (2 µm)
• Rapid gradient method: 6 minutes on C18 (2.7 µm)
• Low pressure isocratic method: 8 minutes on C8 column (2.7 µm)
• Low flow rate for reduced solvent consumption
• Compatibility with mass spectrometry
An orthogonal analysis of a high CBD hemp strain was performed using two different stationary phases. The instructions provided below were used to prepare the hemp extract and standard solutions for cannabinoid quantitation. The Low Pressure Isocratic and Rapid High-Resolution methods were selected to determine potency (total THC and CBD) of the hemp flower.
Chemical Structure of 17 Cannabinoids
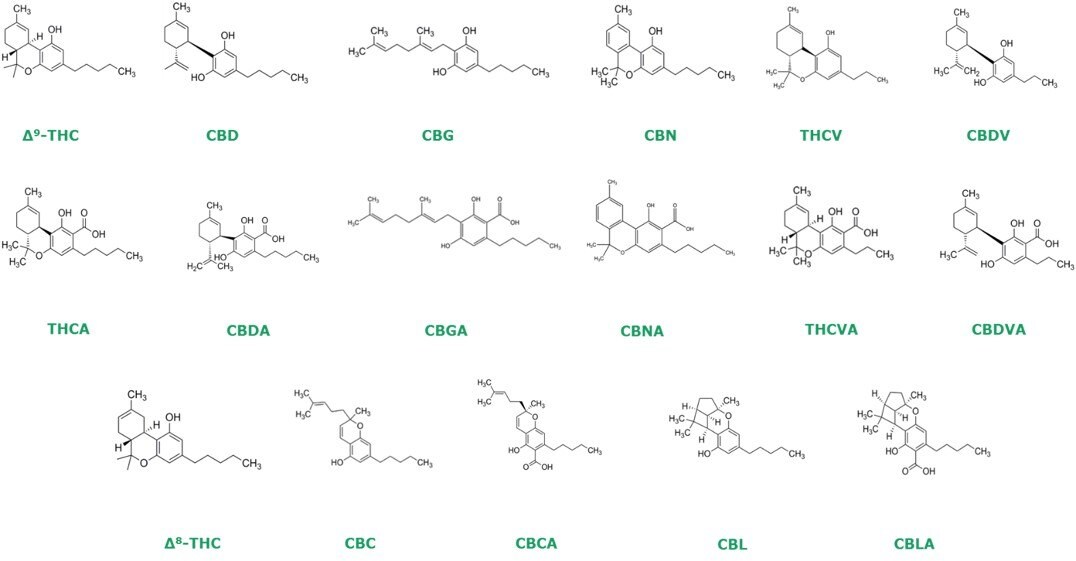
Sample Preparation of Standard Solutions, Peak Identification Solution, and Hemp Extract
Preparation of Hemp Flower Extract
Step | Hemp Flower Extract Preparation |
---|---|
1 | Homogenize 5 g hemp flower (particle size ≤ 1mm). Note: Frozen ball-milling is the preferred method of homogenization without sample degradation. Low temperature homogenization prevents degradation of analytes and produces uniform particle sizes. It is essential to ensure sampling protocol adheres to local guidelines and provides an accurate representation of the bulk material. (See reference: Guidance for State Medical Cannabis Testing Programs) |
2 | Weigh 0.5 ±0.01 g on a calibrated microbalance and transfer sample into a 50 mL polypropylene centrifuge tube |
3 | Dispense 20 mL ethanol into tube and vortex briefly, incubate sample on horizontal shaker for 30 mins at 250 rpm. |
4 | Centrifuge sample at 4000 rpm for 5 mins to pellet plant material. |
5 | Carefully pour supernatant into amber 50 mL volumetric flask and set aside for second extraction. |
6 | Perform second extraction of material with 20 mL ethanol and add extract to amber 50 mL volumetric flask containing contents of the first extraction. |
7 | Fill flask to mark with ethanol and mix well. |
8 | Perform 1:10 and 1:100 dilution of sample with methanol |
9 | Filter samples directly into HPLC vials with 0.2 µM PTFE membrane Note: Sample filtering can be performed using a Millex syringe filter or Samplicity G2 Filtration System for high throughput applications. |
Preparation of Mobile Phases
Mobile Phase | Instructions |
---|---|
5 mM Ammonium Formate + 0.1% Formic Acid | 1. Prepare 0.1% formic acid by adding 1 mL formic acid to 1 L water, mix well. Alternatively, use pre-formulated 0.1% formic acid water solution 2. Add 315.3 mg ammonium formate to 0.1% formic acid and mix well. |
0.1% Formic Acid in Acetonitrile | Add 1 mL formic acid to 1L acetonitrile and mix well. Alternatively, use pre-formulated 0.1% formic acid acetonitrile solution. |
Preparation of Standard Solutions
Step | Instructions | |||
---|---|---|---|---|
1 | To a 10 mL amber volumetric flask, add 1 mL of the following CRMs: | |||
# | Cannabinoid | Product Number | mg/mL | |
1 | CBDA | C144 | 1.0 | |
2 | THCA | T-093 | 1.0 | |
3 | CBG | C-141 | 1.0 | |
4 | CBD | C-045 | 1.0 | |
5 | CBN | C-046 | 1.0 | |
6 | ∆9-THC | T-005 | 1.0 | |
2 | Fill to mark with methanol and shake well for a final solution of 100 µg/mL each analyte. | |||
3 | Perform the following dilution scheme to obtain a 6-point calibration curve: | |||
µg/mL | Dilution Factor | |||
100 | 1 | |||
25 | 4 | |||
5 | 5 | |||
1 | 5 | |||
0.5 | 2 | |||
0.25 | 2 | |||
Note: Standard solutions can also be prepared gravimetrically to improve accuracy and reduce lot-to-lot variation. |
Preparation of Peak Identification Solution
Step | Instructions | |||||||
---|---|---|---|---|---|---|---|---|
1 | Mix following CRMs with assigned volume in a 1.5 mL autosampler vial. | |||||||
# | Cannabinoid | Product Number | mg/mL | Volume | ||||
1 | Cannabinoid Mixture (Neutrals) | C-219 | 0.5 | 100 | ||||
2 | Cannabinoid Mixture (Acids) | C-218 | 0.5 | 100 | ||||
3 | CBLA | C-171 | 0.5 | 50 | ||||
4 | CBNA | C-153 | 1.0 | 50 | ||||
5 | CBL | C-154 | 1.0 | 50 | ||||
2 | Add 650 μL methanol and mix well for a final concentration of 50 μg/mL for each analyte(25μg/mL for CBLA). Alternatively, CRMs containing single cannabinoids as shown in materials table can also be used to make the peak identification solution. |
Chromatography
System and Method Parameters (Rapid High-Resolution, Rapid Gradient, and Low Pressure Isocratic Methods)
Method | Low Pressure Isocratic | Rapid High-Resolution | Rapid Gradient |
---|---|---|---|
Column | Ascentis® Express C8 (2.7 µm) 150x3.0 mm | Ascentis® Express C18 (2 µm) 150x2.1 mm | Ascentis® Express C18 (2.7 µm) 150x3.0 mm |
Mobile Phase A | 5 mM Ammonium Formate + 0.1% Formic Acid in Water | ||
Mobile Phase B | 0.1% Formic Acid in Acetonitrile | ||
Mobile Phase Conditions | Isocratic: 27:73, A:B | 75% to 90% B in 2 min; held at 90% B for 5 min | 75% to 85% B in 2 min; held at 85% B for 5 min |
Flow Rate (mL/min) | 0.7 | 0.4 | 0.8 |
Column Temp. (°C) | 30 | 25 | 25 |
UV Detection (nm) | 228 | ||
Injection (µL) | 5 | 3 | 5 |
Max Pressure (Bar) | 220 | 540 | 250 |
Instrument | Agilent 1290 Infinity II LC System; Quaternary pump; 0.12 mm ID tubing; 10 mm Max-Light Cartridge Cell 1.0 µL |
Chromatograms: Standard Solutions
Low Pressure Isocratic Method: Standard Solution and Blank
Rapid High-Resolution Gradient Method: Standard Solution and Blank
Rapid Gradient Method: Standard Solution and Blank
System Suitability: Peak Identification Solutions
Analyte | Low Pressure Isocratic Method | Analyte | Rapid High-Resolution Gradient Method | Rapid Gradient Method | |||
---|---|---|---|---|---|---|---|
Resolution | % RSD (n=7) | Resolution | % RSD (n=7) | Resolution | % RSD (n=7) | ||
CBDVA | - | 0.2 | CBDVA | - | 0.26 | - | 0.39 |
CBDV | 5.2 | 0.14 | CBDV | 4 | 0.28 | 4.6 | 0.38 |
CBDA | 7.4 | 0.14 | CBDA | 9.7 | 0.27 | 9 | 0.35 |
CBGA | 2.4 | 0.15 | CBGA | 2.6 | 0.27 | 1.8 | 0.36 |
CBG | 4.5 | 0.21 | CBG | 2.5 | 0.29 | 3 | 0.38 |
CBD | 1.6 | 0.14 | CBD | 2.7 | 0.37 | 3.1 | 0.45 |
THCV | 2.1 | 0.47 | THCV | 5.3 | 0.3 | 5 | 0.39 |
THCVA | 5.7 | 0.27 | THCVA | 10.8 | 0.29 | 9 | 0.25 |
CBN | 6.4 | 0.26 | CBN | 4 | 0.3 | 3.4 | 0.36 |
CBNA | 2.8 | 0.54 | CBNA | 8 | 0.48 | 6.6 | 0.59 |
∆-9-THC | 6.8 | 0.36 | ∆-9-THC | 3 | 0.27 | 3.5 | 0.53 |
∆-8-THC | 1 | 0.72 | ∆-8-THC | 1.9 | 0.3 | 1.6 | 0.55 |
THCA | 5.5 | 0.39 | CBL | 6.2 | 0.28 | 5.8 | 0.53 |
CBL | 1.7 | 0.3 | CBC | 2 | 0.3 | 1.6 | 0.44 |
CBC | 1.8 | 0.17 | THCA | 2.1 | 0.26 | 1.4 | 0.39 |
CBCA | 1.5 | 0.35 | CBCA | 4.4 | 0.32 | 4 | 0.71 |
CBLA | 3 | 0.45 | CBLA | 4.1 | 0.37 | 3.6 | 0.69 |
Low Pressure Isocratic Method: 17 Cannabinoids in Peak Identification Solution
Rapid High-Resolution Method: 17 Cannabinoids in Peak Identification Solution
Rapid Gradient Method: 17 Cannabinoids in Peak Identification Solution
Results: Cannabinoid profile and potency of hemp flower | ||
---|---|---|
Analyte | % Weight | Overlay of Peak Identification Solution and Hemp Extract |
CBDA | 18.20 | |
CBG | 0.13 | |
CBD | 1.40 | |
CBN | ND | |
Delta 9 | 0.22 | |
THCA | 0.46 | |
Total THC | 0.62 | |
Total CBD | 17.36 |
Analyte | % Weight | Overlay of Peak Identification Solution and Hemp Extract |
---|---|---|
CBDA | 18.08 | |
CBG | 0.10 | |
CBD | 1.40 | |
CBN | ND | |
Delta 9 | 0.24 | |
THCA | 0.50 | |
Total THC | 0.68 | |
Total CBD | 17.26 |
4.1 Low Pressure Isocratic Method: Linearity and Range (0.25-100 µg/mL)
Peak Area | ||||||
---|---|---|---|---|---|---|
µg/mL | CBDA | CBG | CBD | CBN | ∆9-THC | THCA |
0.25 | 6.5 | 3.8 | 3.8 | 9.2 | 3.1 | 7.8 |
0.5 | 13.2 | 7 | 6.7 | 16.6 | 6.1 | 13.8 |
1 | 26.4 | 13.9 | 14 | 33 | 12.4 | 25.8 |
5 | 137.7 | 71.5 | 72.6 | 170.8 | 64.7 | 128.7 |
25 | 706.1 | 367.5 | 373.1 | 881.9 | 332.4 | 652.5 |
100 | 2813 | 1476.5 | 1512.1 | 3523.4 | 1339.7 | 2581.7 |
4.2 Rapid High-Resolution Gradient Method: Linearity and Range (0.25-100 µg/mL)
Peak Area | ||||||
---|---|---|---|---|---|---|
µg/mL | CBDA | CBG | CBD | CBN | ∆9-THC | THCA |
0.25 | 7.2 | 4.3 | 3.7 | 8.3 | 3.3 | 6.7 |
0.5 | 14.1 | 7.9 | 7.4 | 17.1 | 6.3 | 12.7 |
1 | 28.5 | 15.8 | 16.9 | 34.2 | 13.2 | 25.6 |
0.5 | 143.2 | 73.9 | 76.5 | 176.1 | 67 | 132.3 |
25 | 739.3 | 382.1 | 389.4 | 895.4 | 337.5 | 676 |
100 | 2935.2 | 1534.8 | 1564.1 | 3547.2 | 1350.6 | 2673.6 |
5.0 Conclusion: Accurate analysis of cannabinoids using HPLC
A complete HPLC workflow has been developed to simplify cannabinoid profiling and potency determination. This workflow offers simple sample preparation and a choice of three methods:
- Step-by-step instructions for sample preparation and analysis of 17 cannabinoids
- Rapid High-Resolution Gradient Method: 6 minutes on C18 column (2 µm)
- Rapid Gradient Method: 6 minutes on C18 (2.7 µm)
- Low Pressure Isocratic Method: 8 minutes on C8 column (2.7 µm)
- Low flow rate for reduced solvent consumption
- Compatibility with mass spectrometry
Using the Rapid High-Resolution Gradient and the Low Pressure Isocratic Methods in an orthogonal approach, the total THC was found to significantly exceed the 0.3% total THC limit imposed by the United States Department of Agriculture Interim Final Rule. Results with the Rapid Gradient Method were comparable (data not shown). Although ∆9-THC levels were low, a significant amount of the acidic form (THCA) was present. The hemp sample tested here illustrates the challenges in hemp production to obtain results in a timely manner for harvesting before THC content exceeds regulatory requirements. Rapid and accurate methods support timely analysis of hemp and cannabis.
The results confirmed the high total CBD content, with the majority found to be in the acidic form (CBDA). The results from all methods were in agreement and demonstrated a high degree of selectivity despite the abundance of matrix components.
These methods can easily be adopted to quantitate cannabinoids in plant material spanning concentrations of 0.05–100% by weight. The short run times and low solvent use makes these methods cost-effective for high-throughput potency testing.
Literature
- Quantitation of Cannabinoids in Cannabis Dried Plant Materials, Concentrates, and Oils Using Liquid Chromatography-Diode Array Detection Technique with Optional Mass Spectrometric Detection: Single-Laboratory Validation Study, First Action 2018.11
- AOAC SMPR 2017.002. Standard Method Performance Requirements (SMPRs) for Quantitation of Cannabinoids in Dried Plant Materials
- AOAC SMPR 2019.003. Standard Method Performance Requirements (SMPRs) for Quantitation of Cannabinoids in Plant Materials of Hemp (Low THC Varieties Cannabis sp.)
- AOAC SMPR 2017.019. Standard Method Performance Requirements (SMPRs) for Quantitation of Cannabinoids in Edible Chocolate
- AOAC SMPR 2017.001. Standard Method Performance Requirements (SMPRs) for Quantitation of Cannabinoids in Cannabis Concentrates
- Establishment of a Domestic Hemp Production Program
- Guidance for State Medical Cannabis Testing Programs (Association of Public Health Laboratories)
To continue reading please sign in or create an account.
Don't Have An Account?